Learning Temporal by building a release gate
laug is independent: not affiliated with, sponsored by or endorsed by Temporal Technologies Inc.
Temporal calls it Durable Execution: a promise that your code will finish, even when the machine running it doesn't. It keeps that promise by recording every step a workflow takes, so another machine can pick up where the last one stopped. I wanted to learn how a release is checked against that promise, from the inside, under load and when things break.
laug (pronounced loyg) is Old Norse for a warm pool, the kind the ground keeps hot. laug keeps throwaway Temporal servers warm, loads them, breaks them on purpose and returns a verdict on each release. Every cell here ran on one host, with one history process and one Postgres.
Before you start
There are 19 stops in 7 parts. Each stop opens with its claim and ends with the idea to keep. The fold under each stop holds the exact readings, the files they came from and the commands that reproduce them.
If you run Temporal servers, stops 3 to 7 and 9 to 12 are the ones to check against your own setup. If you write workflows, start with stops 1, 2 and 16 to 18.
Try it. In a clone of the laug repository, three commands build laug, run a gate on fake cells and judge a stored one again, with no Temporal server and no Docker, on Linux with Go, jq and yq v4 installed; runbook 1 lists the rest.
make build
# a whole gate on fakes: ADVANCE, exit 0
bin/laug gate run 1.31.0 -fake
# a committed BLOCK, judged again, byte for byte
bin/laug gate rejudge g20261018-092540
The numbers. Every reading comes from a result file in the repository, except a few from the dev host. The runs fall between October 13 and November 2, 2026. Unless a stop says otherwise, a run used the lab host on AWS and Temporal server 1.31.0; laug's own code used Go SDK 1.49.0. Apart from stop 7's one-minute test at Omes's own rate, every load the stops read ran at 20 workflows a second with at most 50 in flight, against one history process and one Postgres, on one host; with one history process there is no shard movement between hosts and no membership change beyond a role's restart. A boot is one start of the lab or metal host; its runs are a batch. A range such as "5 to 6 seconds" is the spread of the repeated runs, usually 3; it is not a confidence interval. A footnote marks a claim read in source or documentation, not run. In the folds, a figure worked out from other readings says what it was worked out from. What I concluded without measuring it is listed in What I assumed. laug's own report generator draws every figure.
| Host | Stops |
|---|---|
| the lab host, an m8i.8xlarge (32 vCPU, 128 GiB) | every stop, unless it says otherwise |
| the first lab host, an m8i.2xlarge (8 vCPU, 32 GiB) | 4 and 6 |
| the metal host, an m8id.metal-48xl (192 vCPU, 768 GiB) | 8 and 9 |
| the dev host, a Linux VM with 24 vCPU and 47 GiB running Docker | 6 and 14, from records kept outside the repository and quoted in committed files |
What it stands on. Temporal's own tools do much of the work. Omes, Temporal's load generator, drives the load. The
Temporal CLI, temporal, checks the servers. tdbg, Temporal's debug tool, and the server's own fault injector supply
some of the faults. Toxiproxy, Firecracker and Prometheus do the rest.
The words. Temporal's words first, then laug's own. laug's commands and runbooks use the same words.
Temporal's words
- Workflow: the code Temporal keeps running. It must make the same decisions every time it runs, because Temporal rebuilds its state by running it again.
- Activity: a step inside a workflow that does real work, such as calling a service. An activity can fail and be retried; the workflow records its result.
- Worker: your process, which asks the server for work and runs workflow and activity code.
- Event history: the server's record of everything one workflow did.
- Frontend, history, matching: three of the server's roles. The frontend takes every call, history writes events and runs timers, and matching hands tasks to workers.
- Shard: a slice of the workflows. Each history process owns some shards, and only the owner may write to them.
- Cell: one self-contained Temporal deployment with its own database, as Temporal Cloud uses the word.1 laug's cells are throwaway Temporal servers, each on one host with its own Postgres.
laug's words
- Pool: the cells laug keeps warm and ready;
bin/laug pool serveruns it. - Lease: take a cell from the pool for one job, then give it back.
- Raun (Old Norse for a trial): one fault on one leased cell. laug loads the cell, injects the fault, reads the windows before, during and after it, and judges the result.
- Incumbent: the release being replaced, run beside the new one under the same load.
- Gate: judges one release by several items at once, each on a cell of its own, in one wave.
- Item: one thing a gate runs: the new release under a steady load, the new release under a fault, or the incumbent.
- Wave: the items of one gate, run at the same time on the same host.
- A/A and A/B: a gate is A/A when the new release and the incumbent are the same release, and A/B when they differ. The new release and the incumbent are the gate's two arms.
- Verdict: what laug returns for a load, a raun or a gate: ADVANCE (ship it) or BLOCK (don't).
Where a process is killed, it was stopped abruptly, with no chance to clean up. A p99 is the 99th percentile: 99 requests in 100 took no longer than this.
The 19 ideas
One from each stop, in order. Each links to its stop.
- 1Code that does real work belongs in an activity, and workflow code must make the same decisions every time, because it will be run again.
- 2Keep a replay test against real recorded histories, and check that it can fail.
- 3Each readiness signal proves one thing, and only a completed workflow proves the whole path works.
- 4Recovered for the server is not recovered for its clients. Measure both.
- 5When two processes rewrite the same record at startup, have them agree on what it should say, or start them in turn.
- 6Know every wait between an edit and its effect, check the clock before trusting an interval, and make recovery prove itself over time.
- 7Before you put a threshold on a metric, read how it is built. Near a bucket edge, compare the share of requests past the edge, not the percentile.
- 8Copies are one machine inside. Outside, each needs its own network, disk and clock, and fresh randomness.
- 9Set a copy's clock before anything reads it. A lookup that waits out its timeout measures the timeout, not the name.
- 10Aim each fault at one of history's conclusions, and count what it does to the shards, not just to latency.
- 11Inject a fault at the layer you want to learn about; below libraries that retry, it can show nothing.
- 12A gate has to tell "no longer measured this way" from "broken".
- 13Count what the clients saw, and make the gate catch a bad change before you trust it with a good one.
- 14A comparison made in the same wave cancels out the noise of the hour, so measure how far two identical neighbors drift before you trust a tolerance.
- 15Keep a workflow's history on a server that outlives what the workflow tests, and never trust a default address on a shared machine.
- 16Heartbeat, keep heartbeating through the cleanup, and tell a cancel from every other cause before you stop anything.
- 17The history shows only the attempt that finished, so work that must not run twice needs its own guard.
- 18The workflow adds durability, not judgment.
- 19Trust the history for what a workflow did. A trace shows what the workers did, replays included.
Part 1 of 7
How Temporal runs your code
Stops 1 and 2
This part is Temporal's own model, seen through one small workflow: who writes the history, and what a deploy replays.
Stop 1
The server writes every event; the worker only proposes
A worker never writes a workflow's history. It runs your code and proposes the next commands, and the server decides what is recorded.
One small test workflow, HealthCheck, ended with 24 events. The worker asks for work, runs the code until it has to wait, and replies with commands such as "start this activity" or "set a timer". History turns the commands into events.
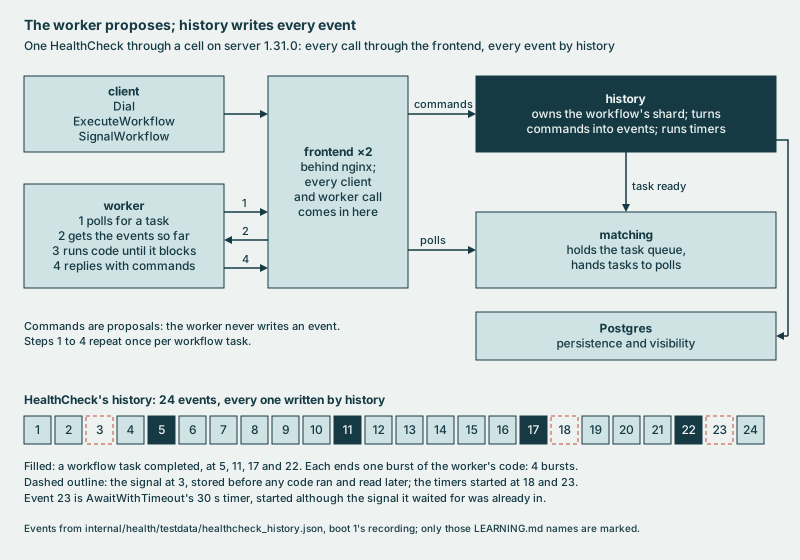
Three things follow:
- The code runs in bursts: 4 for HealthCheck, one for each workflow task.
- A signal sent before the code is ready is kept until the code reads it.
- Timers live in the server. I killed a worker partway through a 60-second timer. The timer fired on time, and a second worker finished the workflow.
One surprise: waiting for a signal with a 30-second timeout started the timer even though the signal had already arrived. The Go SDK has a change that skips the timer when the signal is already there. It sits behind a flag that is off by default in 1.49.0 and still off in 1.50.0.2
The ideaCode that does real work belongs in an activity, and workflow code must make the same decisions every time, because it will be run again.
Readings and sources
- The 4 bursts completed at events 5, 11, 17 and 22. The signal is event 3. The timers are events 18 and 23.
- The worker was killed 20 s after arming a 60 s timer. By the server's events, the timer fired 60.003 s after it started, 0.063 s late by the host's clock.
- Evidence: jq
.events[].eventTypeoverinternal/health/testdata/healthcheck_history.json, a copy of one HealthCheck recorded on a live cell (cells/results/2026-10-23-boot1.txt, A9e and A9f); the killed worker, A9b to A9d in the same file, and its history's timer events,cells/results/2026-10-23-boot1.txt:287. - Try it:
bin/laug health replayruns the replay tests with no server. On a cell from runbook 2,bin/laug health timer 60sarms one timer and reports when it fired.
Stop 2
A deploy is a replay
When you deploy new workflow code, each open workflow is replayed on it at its next workflow task, and replay fails if the new code issues different commands. Under Worker Versioning, a Pinned workflow is the exception: it stays on the Worker Deployment Version it started on, and a new build takes it only when an operator moves it.3
To resume a workflow, a worker runs the code from the top and feeds it the recorded events instead of redoing the work. The Go SDK checks that the code issues the same commands in the same order. It compares each command's type and ID, never its values.4
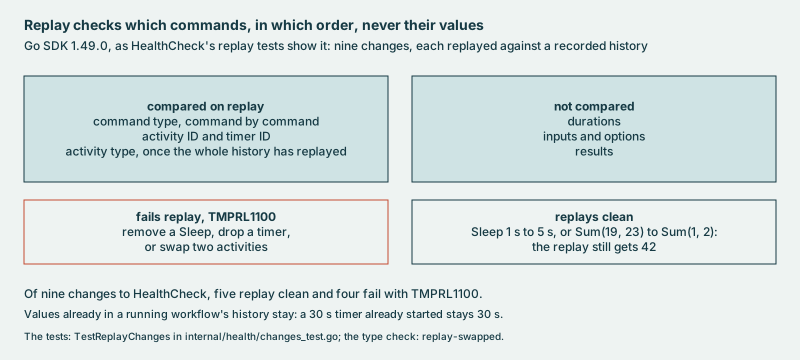
Of nine changes to HealthCheck, five replayed cleanly. The four that changed which commands run, or their order, failed.
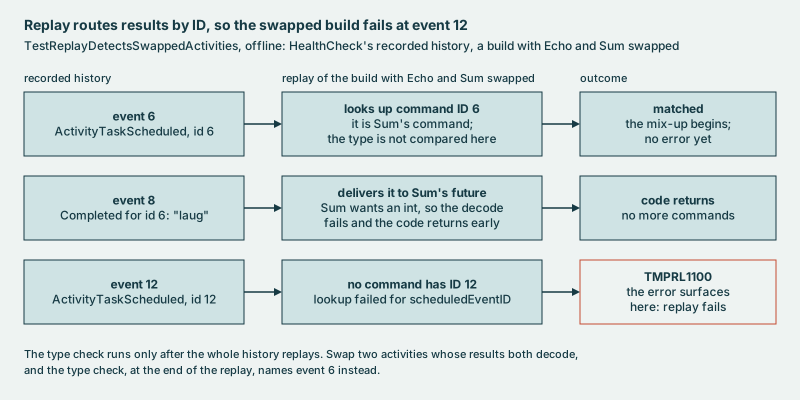
A failure doesn't always point at its cause. Results are matched by ID, so a build with two activities swapped hands one activity's result to the other before any name is checked. The error appears at event 12, where the code runs out of commands to match, not at event 6, where the mix-up began.
My replay test once couldn't fail at all. I had piped go test into grep without pipefail, so the build only ever
saw grep succeed. Every recipe in the Makefile sets pipefail now.
The ideaKeep a replay test against real recorded histories, and check that it can fail.
Readings and sources
- The four failing changes fail with TMPRL1100, the Go SDK's nondeterminism error. The Makefile sets
.SHELLFLAGS := -o pipefail -c. - Evidence: TestReplayChanges in
internal/health/changes_test.go(9 of 9) and TestReplayDetectsSwappedActivities ininternal/health/replay_test.go(TMPRL1100 at event 12) replayinternal/health/testdata/healthcheck_history.json, a copy of the HealthCheck stop 1 counts, recorded on a live cell (cells/results/2026-10-23-boot1.txt, A9e and A9f). - Try it:
go test ./internal/health -run TestReplay -v, ormake test-go, which runs them with the rest.
Part 2 of 7
Inside a cell
Stops 3 to 7
This part is Temporal's server as laug runs it: what its signals prove, and what a restart, a cold start and a config change cost.
Stop 3
Answering is not working
A Temporal server reports healthy seconds before it can run a workflow. Only a completed workflow proves the whole path works.
A cell has four roles (frontend, history, matching and an internal worker) and two databases. laug runs the roles as five processes, with two frontends. History splits workflows into a fixed number of shards. Each shard has one owner, which proves ownership with a fenced range ID: a counter that stops an old owner from writing after a new one takes over.5 The default image uses 4 shards; laug uses 512.
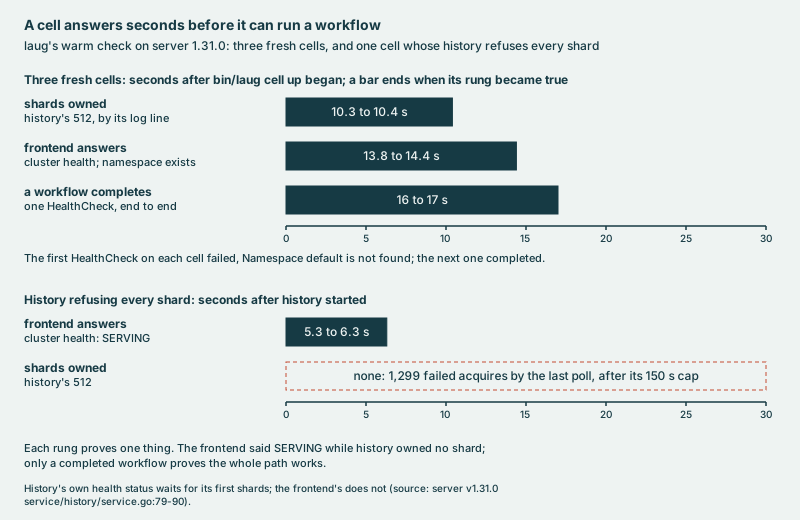
On fresh cells, counting from the start of bin/laug cell up, history owned its shards at about 10 seconds, and the
frontend's health check answered at about 14. The first workflow then failed to start, with "Namespace default is not
found", though the namespace had answered a describe a moment before, which reads as a frontend's namespace cache still
catching up. The second completed by about 17 seconds.
With history refusing every shard, the health check still said SERVING about 6 seconds after history started, while the cell owned no shards at all. That's by design. History's own health check waits for its shards,6 but the frontend's, the one you usually ask, reports only on the frontend.
A gauge of owned shards has the same trap: a history that's down reports no data at all, so an alert must treat "no data" as down.
The ideaEach readiness signal proves one thing, and only a completed workflow proves the whole path works.
Readings and sources
On three fresh cells, history logged its 512 shards ready 10.3 to 10.4 s after bin/laug cell up began, and
temporal operator cluster health and the namespace answered at 13.8 to 14.4 s. The first HealthCheck failed with
Namespace default is not found; the next completed at 16 to 17 s, a time the first item below works out.
- The 16 to 17 s: a HealthCheck's workflow ID holds its start in Unix milliseconds (
internal/health/check.go:136), and it completed 1,111 to 1,140 ms later (docs/tables/quotes.jsonl#cells/results/2026-10-23-boot1/extra/a4-health-1.txt:15,docs/tables/quotes.jsonl#cells/results/2026-10-23-boot1/extra/a4-health-2.txt:14anddocs/tables/quotes.jsonl#cells/results/2026-10-23-boot1/extra/a4-health-3.txt:15). The zero is history's shards line less the 10.3 to 10.4 s (docs/tables/readings-2026-10-23-boot1.jsonl#A4/ready_1and the two after it). A4 itself records 24.5 to 24.9 s: whenbin/laug cell healthreturned, which waits after the workflow until Prometheus has the 5 server targets up (cells/health.sh). - With every shard refused, one cell answered SERVING at its second poll, 5.3 to 6.3 s after history started (polls stamped to the whole second), and logged 1,299 failed acquires by its last poll, after its 150 s cap. The warm check reads the shard log only since the container's last start, because a restarted container keeps the old lines.
- Evidence:
cells/results/2026-10-23-boot1.txt, A3 (4 shards, by history's line and the shards table), A4 (the fresh cells) and A7 (SERVING, 0 shards); the 512 incells/compose/cell.yml; the check incells/backend-compose.shandcells/shards-ready.sh; "no data" read as down in kill-history'ssignal_query,faults/catalog.yaml. - Try it:
bin/laug cell up, thenbin/laug cell health. Runbook 2 leases a cold cell instead, from a pool that holds one at most and keeps none warm.
Stop 4
A restart costs more than it shows
Restart history and the server recovers within a second, but clients still see failures into the 12th second after it.
With history killed under load, nothing completes. Restarted, it owns all 512 shards again in about half a second, and laug's recovery signal, polled every 5 seconds, reads clear 5 to 10 seconds after the restart. Clients see more. While history was down, their starts failed in bursts of 49, 10 seconds apart. After the restart, 44 to 51 more failed, almost all in the first 4 seconds, the last up to 12 seconds after it. That burst reads as the tail of the outage: starts sent while history was down, each failing as its 10-second deadline ran out.
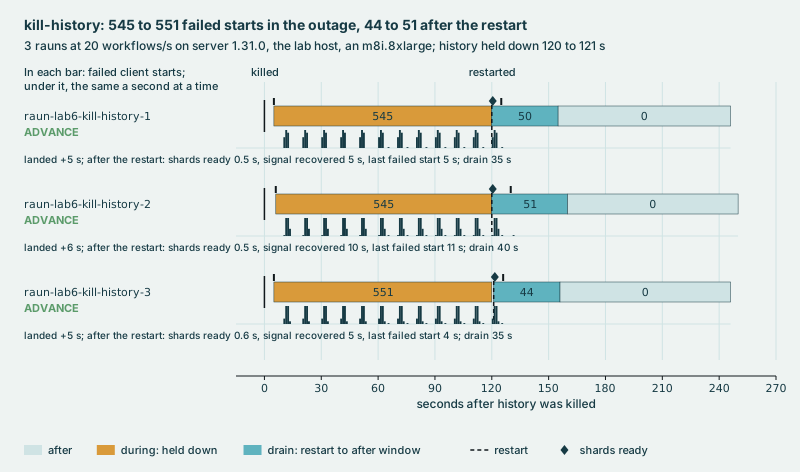
On the first lab host, my first verdict window opened the moment the signal cleared. In 1 raun of 3, starts were still failing at their deadline, and the verdict called that a regression. laug now waits 30 seconds after recovery before that window opens. It records the starts that fail from the restart until then, and they don't decide the verdict.
The ideaRecovered for the server is not recovered for its clients. Measure both.
Readings and sources
- History was held down 120 to 121 s at 20 workflows a second, each raun on a cold lease. 545 to 551 starts failed during the hold and 44 to 51 in the window from the restart to the after window, which ran 35 to 40 s; the after window counted 0. The shards were back 0.5 to 0.6 s after the restart.
- In the hold, each burst held 49 over 3 or 4 seconds, 10 s apart, and from about a minute in, 1 more failed midway between bursts. Counted from the failed starts by second, each second floored, 43 to 49 failed in the first 4 s after the restart, and the last at +4 to +11 s. One raun's burst began 1 s before the restart, with 6.
- A raun keeps at most 50 starts in flight, and a start's client deadline is 10 s, so 49 failing every 10 s fits starts that each wait out their deadline. The bins keep no error message, so on the lab host no log names the deadline; the first window's load log does.
- Three earlier rauns on the lab host, with the same 30 s wait, counted 63 to 97 failed starts in the same window, 35 to 36 s long, and timed none of them. The files don't say why they hold more.
- My first verdict window, on the first lab host, opened at the first poll that read clear. That was 6 s after the restart in the raun that BLOCKed, and 10 s in the 2 that ADVANCEd. The BLOCKed raun's load log shows outage starts failing at their deadline inside that window. With the 30 s wait, the next 3 ADVANCEd.
- Evidence:
cells/results/2026-10-27-boot6.txt, A4, withfaults/results/raun-lab6-kill-history-{1,2,3}.json(.iterations_failed,.history_shards_ready_s,.time_to_recover_s) and the failed starts by second,docs/tables/fig-kill-history.jsonl#raun-lab6-kill-history-1/and the two beside it (.s,.n); the 50 in flight,-max-concurrentincmd/laug/doc.go; the 30 s,settle_sinfaults/catalog.yaml, which names the 10 s deadline; the restart's window, recorded and not judged,faults/README.md, The three windows; the earlier rauns,docs/tables/records.jsonl#cells/results/2026-10-17-lab-kill-history.txtand the rows of raun-lab-kill-history-{1,2,3}; the first window, the rows of raun-kh{1,2,3}-0723, with kh3's load log atdocs/tables/quotes.jsonl#cells/results/2026-10-13-ec2.txt:73-74, and, with the wait, raun-khs{1,2,3}-0743; each row indocs/tables/rauns.jsonl. - Try it:
bin/laug raun kill-history, as runbook 3 runs a raun.
Stop 5
Started is not ready
Started at the same moment, a cell's two frontends race to rewrite one database record, and one of them can exit.
Of 10 new cells, 4 took 54 to 130 seconds to pass laug's warm check, which ends with a completed workflow (stop 3). Every role reads one shared cluster metadata record when it starts. It writes the record if it is missing or differs from the role's own settings, and a version number guards the write so that two writers can't both win. laug's two frontends, kept from Temporal's multi-role compose sample, listen on 7237 and 7236 while the other roles name 7233, so each frontend always rewrites the record. Started together, they collide. The one that loses retries once, 40 to 50 ms later, with the version it already read. So it loses again and exits,7 and Docker restarts it. A frontend exited in 4 of 10 cells; in 3 more, one logged the mismatch and stayed up, which that one retry does not explain. With one frontend on the default port, every role names one address, so after the first write no role rewrites the record.8 I ran that. 20 cells with one frontend, in the start order before the fix, logged no mismatch and restarted nothing. Of 20 with two frontends, a frontend exited in 3. Three in 20 against none could still be chance, at a one-sided Fisher exact p of 0.1154; the missing mismatch lines are the stronger sign.
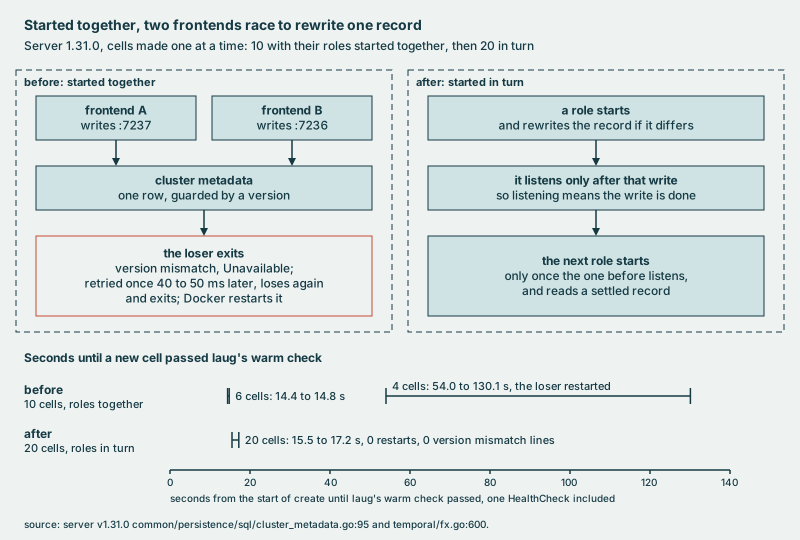
The fix changed only the start order: history, then matching and the first frontend, then the second frontend, then the internal worker, each after the one before is listening. All 20 cells then passed the warm check in 15.5 to 17.2 seconds, with no restarts. The fix has a cost. Before it, the 6 cells with no restart passed in 14.4 to 14.8 seconds, so the order costs about 1 to 3 seconds a cell. I chose that over 54 to 130 seconds on 4 cells in 10.
The ideaWhen two processes rewrite the same record at startup, have them agree on what it should say, or start them in turn.
Readings and sources
- Each time adds a cell's create to its time to healthy, so it runs from the start of
createincells/backend-compose.shuntil laug's warm check passed. The check ends with one HealthCheck. Before the fix, 4 cells took 54.0 to 130.1 s and 6 took 14.4 to 14.8 s, 3 of those 6 logging 2 "version mismatch" lines each with no restart. After it, 20 of 20 took 15.5 to 17.2 s, with 0 restarts and 0 mismatch lines. The order costs 0.7 to 2.8 s: 15.5 less 14.8, and 17.2 less 14.4. - Create took 9.5 to 10.9 s before the fix and 13.8 to 15.5 s after, since each role now waits for the one before. The warm check after create took 3.9 s in each of the 6, 44.5 to 119.5 s in the 4 slow ones, and 1.7 s after the fix.
- Evidence: the 10 cells before the fix,
docs/tables/quotes.jsonl#cells/results/2026-10-15-startup-race.txt:29-38, and the 20 after,docs/tables/quotes.jsonl#cells/results/2026-10-15-startup-race.txt:53-55, withdocs/tables/quotes.jsonl#cells/results/2026-10-15-startup-race.txt:19-25(the ports each role writes); the start order incells/compose/cell.yml, and the two frontends' ports at :184 and :200; the sample the cell came from,cells/compose/cell.yml:2; the run with one frontend,cells/results/2026-11-02-frontend1.txt. - Try it:
bin/laug cell upstarts the roles in turn.
Stop 6
Knobs arrive late, and clocks can be wrong
A configuration change reaches each Temporal role only when that role next re-reads its file, so the same change can land in seconds or take most of a minute.
Each role re-reads its dynamic config file on its own timer, every 60 seconds as the server's config template sets it, and each role's timer starts with the role.9 Two edits reached one cell's five server processes 14 to 19 seconds and 43 to 48 seconds after they were made, which fits each role re-reading on its own cycle. Then the change had two more waits: the frontend's rate limit takes up a new value at most once a minute,10 and laug's signal averages over 30 seconds.
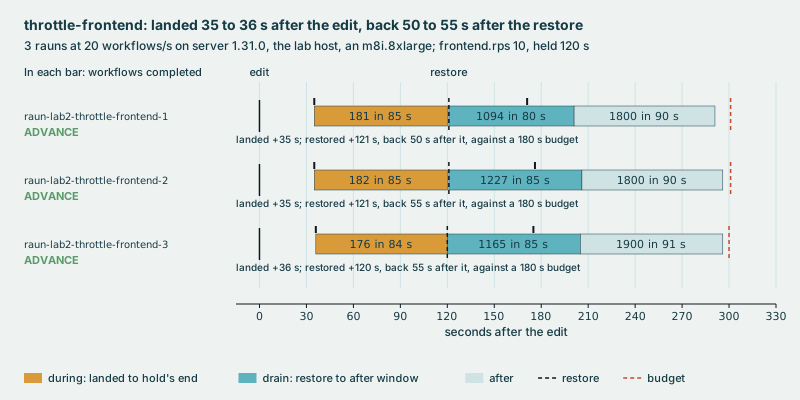
My first time budget for this fault, 120 seconds, was a guess. On the first lab host, 2 rauns of 3 recovered at 123 seconds and failed it, inside what the three waits allow. Budgets now come from the mechanism: this fault gets 180 seconds. On the lab host, rauns recover in 50 to 55 seconds on containers and in 60 to 116 on microVM cells.
Three traps sat nearby:
- One shared config file meant throttling one cell throttled every cell. Each cell now gets its own copy, mounted as a folder, because laug's edit writes a new file and moves it into place, which a single-file mount never sees.
- An interval is only as good as the clock. On the dev host, the wall clock moved 1.045 to 1.048 seconds for each
second of the uptime clock, so a 90-second window read about 94. On the lab host the ratio read 0.9999.
bin/laug host clockcompares them, and a gate records every step on both. - Crash loops keep their own schedule. After an out-of-memory kill, history came back 30 to 35 seconds after the memory limit was lifted, most likely when Docker's restart backoff allowed it.11 A recovery check that trusted one good sample was fooled by the flapping, so it now needs 30 seconds of good samples.
The ideaKnow every wait between an edit and its effect, check the clock before trusting an interval, and make recovery prove itself over time.
Readings and sources
- One cell's five server processes took up the first edit 13.5 to 18.6 s after it and the second 43.1 to 48.1 s after it. The edits were 90.465 s apart by their clock times, and each process took 29.5 to 29.6 s longer to take up the second. So it took up the second 120.0 to 120.1 s after the first: two periods of 60.0 s.
- The 123 s rauns were on microVM cells on the first lab host. On the lab host, 3 of 3 rauns on containers recovered in 50 to 55 s and 3 on microVM cells in 60 to 116 s. The 116 s raun BLOCKed on end-to-end p95 in its after window, not on the budget. Two more on microVM cells, on cold leases, landed in 56 s and recovered in 76 s each.
- The wall clock kept pace with the uptime clock to 0.9999, with no step over 0.5 s in 60 s. After the out-of-memory kill, history's shards were ready 29.7 to 35.1 s after the limit was lifted.
- On the dev host, wall over monotonic read 1.048, then 1.045, as
cells/results/2026-10-23-boot1.txt:69 quotes it from an older status page; it doesn't say which clock was off. A 90 s window at 1.045 is 94.05 s of wall clock, 90 times 1.045, asload/lost-work.sh:122-124 works it out. - Evidence:
cells/results/2026-10-23-boot1.txt, P6 (the edits) and H1 (the clock);cells/results/2026-10-23-boot2.txt, R8 and R9 (the rauns on containers); the microVM rauns,cells/results/2026-10-24-batchE.txt, F, andcells/results/2026-10-29-boot9.txt, F; the 123 s rauns, the rows of raun-fcthrottle{1,2,3} indocs/tables/rauns.jsonl. - Try it:
bin/laug host clock -for 60s;bin/laug raun throttle-frontend, as runbook 3.
Stop 7
A percentile is a bucket position
A server's p99 latency tells you which bucket the 99th percentile fell in, not how long any request took.
Temporal's latency histograms have default bucket edges: 1, 2, 5, 10, 20 and 50 milliseconds, on up to 1,000
seconds.12 A server's metrics config can replace them, in perUnitHistogramBoundaries; laug's cells keep the
defaults.13 A p99 is interpolated inside one bucket.14 A reading just under 10 ms says "under 10", not "9.98".
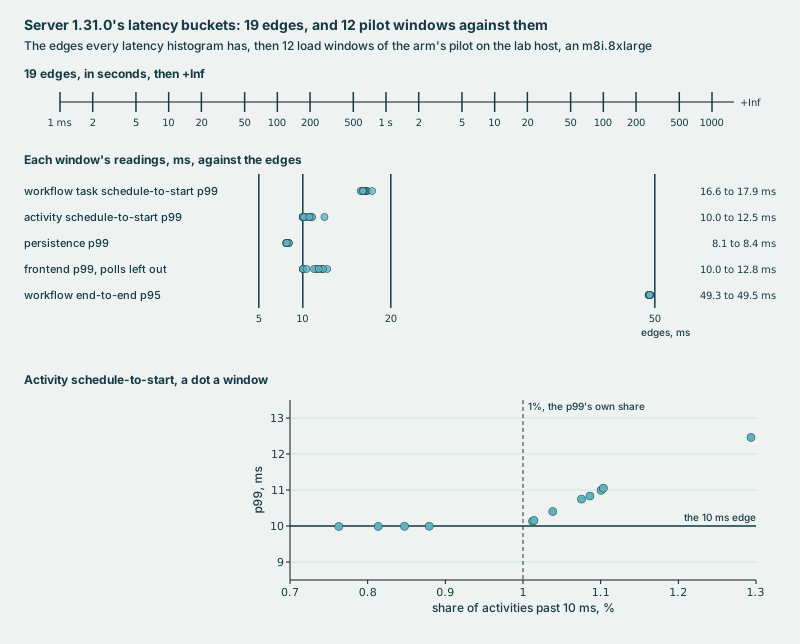
In laug's baseline, three readings sat just under an edge: 9.985, 9.996 and 49.38 ms. Across three loads the activity p99 held at 9.98 to 9.99 ms, while the share of activity tasks that waited over 10 ms ranged from 0.69% to 0.88%. The share showed what the percentile couldn't.
Polls and errors need care too:
- Long polls. Workers wait up to 60 seconds for work,15 so their polls make the frontend look slow. On a cell running one HealthCheck every 10 seconds, the frontend p99 read 19,600 ms with polls and 9.93 ms without.
- "Canceled" errors. In matching, Canceled means a forwarded task found no waiting worker and was stored instead.16 In a one-minute test, every error was Canceled.
The ideaBefore you put a threshold on a metric, read how it is built. Near a bucket edge, compare the share of requests past the edge, not the percentile.
Readings and sources
- The baseline's second run,
docs/tables/loads.jsonl#labbase2-124757: activity schedule-to-start p99 9.985 ms, frontend p99 without polls 9.996 ms and end-to-end p95 49.38 ms, whichload/baseline.mdrounds to 10.0, 10.0 and 49.4. - With polls included, 26.4% of that frontend's requests sat in the 50 to 100 s bucket over the cell's first 4 minutes; the 19,600 ms p99 is the last of those minutes. Over a 61 s test, Canceled was 0.33% of requests.
- Evidence:
load/baseline.md;load/results/lab1-v1310-{1,2,3}.baseline.json; the edges atdocs/tables/quotes.jsonl#cells/results/2026-10-17-arm-pilot.txt:530; the cells' metrics config, which sets no edges, in laug's copy of the image's template,cells/compose/config/laug-server.yaml:328-333;cells/results/2026-10-23-boot1.txt, A5c (long polls) and A6f (Canceled). - Try it:
bin/laug baseline <run>after a 5-minute load like the one runbook 2 runs.
Part 3 of 7
Many cells from one snapshot
Stops 8 and 9
This part is mostly laug's own machinery: cloning a running cell, so a lease is ready in seconds instead of half a minute. Its Temporal lesson is about clocks (stop 9).
Stop 8
A warm cell as a memory image
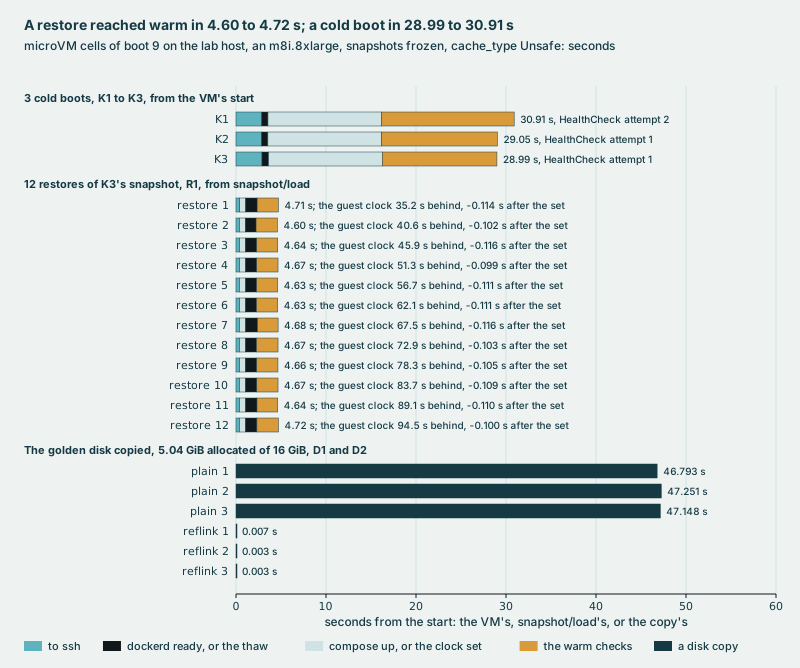
A running Temporal cell saved as a microVM snapshot comes back ready in under 5 seconds. Booting one from scratch takes about 30.
Firecracker runs small virtual machines, called microVMs, that can pause and save their whole memory to a file. laug boots a cell once, waits until it is warm, freezes its containers, snapshots it and restores copies. Loading the snapshot takes a hundredth of a second, most likely because the memory file is mapped, not read. Most of the 4.7 seconds goes to resuming, setting the clock, thawing the cell's containers and proving the cell works.
Every copy wakes as the same machine:
- The disk isn't in the snapshot. Each restore first makes a reflink copy of the golden disk, a copy that shares blocks until they change. That takes milliseconds; a plain copy took about 47 seconds.
- The clock is behind. Restores came back 35 to 95 seconds behind. So the clock is set from the host before any check, and the cell's containers, frozen in the snapshot, run again only after that.
- The network identity is the same, down to the IP address, and so is the warm-up workflow in the cell's history. Each copy gets its own network namespace, so two copies with the same address inside never meet.
- The random state and any secrets in memory are the same. laug's cells hold no secrets, so this is harmless here. Firecracker gives each copy a new VM Generation ID, and the guest kernel reseeds its random number generator from it.17 In two copies the kernel logged one reseed each, and their random bytes differed. Random state a process already holds, such as a seeded generator or a key, stays the same in every copy. Anything built on this pattern must reseed each copy when it wakes.
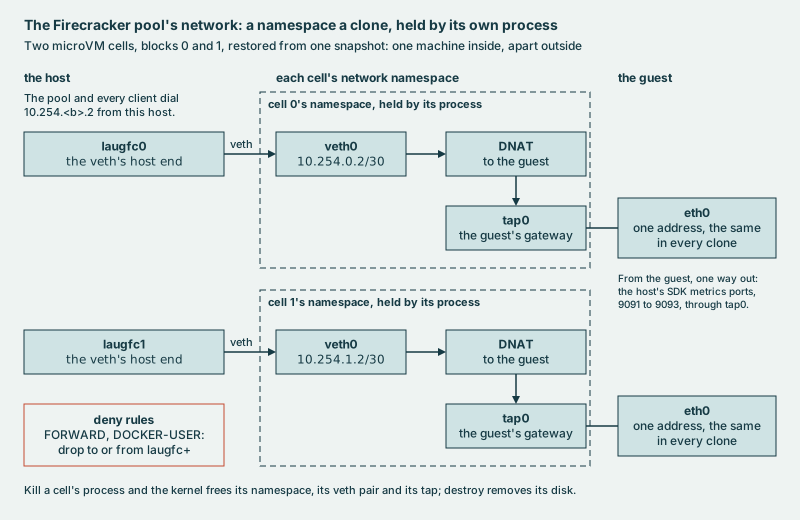
If a copy's process exits for any reason, the kernel removes its network with it, so no network is left to clean up. Faults take effect as they do on containers: on warm leases, killing history took effect in 6 seconds on microVM cells and in 5 to 6 on containers.
The metal host's idle states. On the lab host a microVM runs nested, inside an EC2 VM, and the load alone ran slower there. In the 4 vCPU microVM, about 4 times as many workflows took over 50 ms as in containers held to 4 CPUs. On the metal host, one machine with no hypervisor under it, containers read worse at its default idle states, and worst when all 32 CPUs were set aside for the cells. Other runs turned off the two deepest idle states, C6 and C6P, on those CPUs. In those, the 4 vCPU microVM and containers on 4 or 32 CPUs each kept the share of workflows over 50 ms under 1%. So on this one metal host, nearly all of the gap seen nested reads as the cost of nesting itself. The files don't say which of the two idle states matters.
Nested, a copy may also need a minute or two after it wakes. In 36 of 52 rauns loaded 5 seconds after the restore, the copy's frontend latency sat over its threshold before any fault. Every copy left idle a minute or more stayed under it. In a later run, 3 of 3 copies left idle 2 minutes held every threshold before their fault. At the first run's rate, 14 of 52 steady before their fault, 3 of 3 happens by chance about 2 times in 100. That supports the first minutes as the cause; it does not prove it.
The ideaCopies are one machine inside. Outside, each needs its own network, disk and clock, and fresh randomness.
Readings and sources
- On microVM cells nested on the lab host, snapshots frozen, cache mode Unsafe: cold boot to warm 28.99 to 30.91 s (3
boots);
snapshot/createafter warm 33.63 to 33.92 s; restore to warm 4.60 to 4.72 s (12 restores), of whichsnapshot/loadreturns in 0.01 s and the thaw of 11 containers takes 1.18 to 1.32 s. The golden disk, 5.04 GiB allocated, took 46.79 to 47.25 s by plain copy after a cache drop and 3 to 7 ms by reflink. - The memory file is just over 4 GiB on disk (
du -hread 4.1G, rounding up), for a guest given 4,096 MiB. Each cold boot froze its 11 containers in 0.29 to 0.31 s before the snapshot. The 12 restores came back 35.2 to 94.5 s behind, each 5.3 to 5.4 s more than the one before: the 12 took 64.8 s in all, 5.4 s each, 64.8 over 12. The clock was set 0.83 to 0.85 s aftersnapshot/load, and each thaw was done 2.23 to 2.39 s after the load. - On warm leases, 8 of 12 rauns on microVM cells ADVANCEd. Each of the 4 BLOCKs was end-to-end p95 over its 84 ms threshold, 2 of them before their fault. Before any fault it read 62.50 to 90.52 ms on microVM cells against 49.27 to 50.85 ms on containers.
- On cold leases, loaded about 5 s after the create, 52 rauns: 12 ADVANCE, 2 did not land, 38 never steady before any fault, 36 of them on frontend p99 at 22.47 to 37.93 ms against 22; end-to-end p95 69.90 to 85.00 ms. The 14 copies left idle 70.7 s or more first read frontend p99 16.02 to 18.83 ms.
- Five-minute loads at 20 a second after 60 s idle (120 s for each arm's first), 10 each, medians: containers 4.26% of workflows over 50 ms (end-to-end p95 49.61 to 49.93 ms), on 4 pinned CPUs 2.49% (49.10 to 49.30 ms), jailed microVM cells 9.75% (62.53 to 79.96 ms); frontend calls over 10 ms 2.88% in the microVM against 0.80% on 4 CPUs. The microVM's share is 3.9 times the pinned containers', 9.75 over 2.49, computed. 3 disk-slow rauns, each on a copy idle 120 s, read frontend p99 18.57 to 18.95 ms before their fault; at the cold-lease rate, 14 steady in 52, 3 of 3 by chance is (14/52)^3, 0.0195.
- Another run of the same loads, medians: microVM cells at 8 vCPU 3.22% of workflows over 50 ms (end-to-end p95 49.31 to 49.70 ms, 10 loads), at 4 vCPU 9.09% (69.62 to 79.86 ms, 5); containers on 4 pinned CPUs 2.58% (49.15 to 49.35 ms, 10), their servers at GOMAXPROCS 4, against 32 unpinned and 8 or 4 in the guest. Paired by round, 8 vCPU less 4 read -24.87 ms of end-to-end p95, -27.77 to -21.98 by the t interval over 9 rounds, -30.93 to -18.82 at the level of the loads, since the rounds share 5 microVM loads at 4 vCPU. 8 vCPU closed 0.90 of the 4 vCPU cell's gap to the pinned containers on that share, (9.09 less 3.22) over (9.09 less 2.58), and 0.79 to 0.97 by the bootstrap. The host's busy CPUs under load read 6.17 to 6.23 at 8 vCPU against 3.94 to 3.96 at 4, 2.24 more at the medians, while the guest did the same work, 1.82 to 1.91 busy CPUs against 1.78 to 1.83. Part of the 2.24 may be KVM halt polling, which yields when another task wants the CPU18, so it bounds one cell's cost, not what several would take.
- On the metal host at its default idle states, medians: microVM cells at 4 vCPU 0.90% (end-to-end p95 48.73 to 48.77
ms, 6), at 8 vCPU 0.74% (48.68 to 48.75, 6); containers on 4 pinned CPUs 9.77% (69.83 to 75.98, 6), on 32 pinned CPUs
99.71% (177.62 to 179.62, 6 BLOCK). With C6 and C6P off on the 32 CPUs set aside for the cells: microVM cells at 4
vCPU 0.39% (48.60 to 48.66 ms, 3), containers on 4 pinned CPUs 0.85% (48.74 to 48.75, 3), on 32 0.52% (48.61 to 48.67,
3 ADVANCE); on 32 CPUs at the defaults 99.66% (181.23 and 182.13, 2 BLOCK) and with NUMA balancing off 99.60% (180.30
and 182.38, 2 BLOCK). Those BLOCKs are
load/steady-state.yaml's, set on the lab host's type and applied to another. The run with C6 and C6P off had a check for a running package upgrade that misfired, and one upgrade overlapped one load's last 36 s; all 15 loads are counted. - Evidence:
cells/results/2026-10-29-boot9.txt, K, R and D (the timings), P6a (the reseeds), F (the rauns) and What it shows (the idle), withdocs/tables/readings-2026-10-29-boot9.jsonl;cells/results/2026-10-24-batchE.txt, F (the warm-lease rauns); the loads,docs/tables/quotes.jsonl#cells/results/2026-10-29-boot10.txt:351-352and the idle copies,docs/tables/quotes.jsonl#cells/results/2026-10-29-boot10.txt:643; 8 vCPU,docs/tables/quotes.jsonl#cells/results/2026-10-29-boot11.txt:399-400, :402, :542-544 and :550; the metal host,docs/tables/quotes.jsonl#cells/results/2026-10-30-boot12.txt:303-304and :307-308;docs/tables/records.jsonl#cells/results/2026-11-01-boot13.txt, V1 to V9 (the settings), with the groups,docs/tables/quotes.jsonl#cells/results/2026-11-01-boot13.txt:269-271and :274-275, and the upgrade check,docs/tables/quotes.jsonl#cells/results/2026-11-01-boot13.txt:61-66; the network, each cell at its own10.254.<b>.2, incells/backend-firecracker.sh. - Try it:
sudo bin/laug pool serve -backend firecracker, ascells/rootfs/README.mdsets it up. Runbook 1 runs the same pool on fakes, with no server.
Stop 9
Time and names inside a copy
Fixing a wrong clock doesn't fix a countdown that is already running. The server keeps counting down a wait it worked out from what the clock said at the time.
I set the guest's clock 2 minutes slow, 5 seconds after a 60-second timer started. The timer fired 2 minutes late by real time, while the server recorded 60 seconds: on time, by its own clock. Setting the clock right didn't help at once.
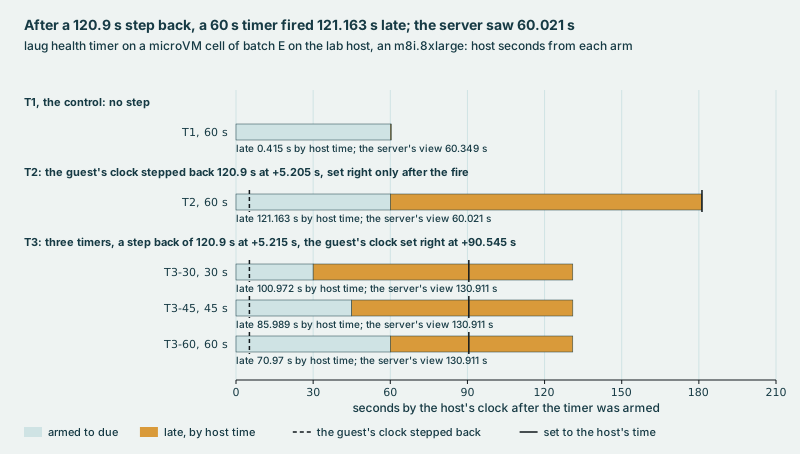
I armed three timers, of 30, 45 and 60 seconds, and 5 seconds later set the clock back by the same 2 minutes, then set it right 90 seconds in. All three fired together, about 40 seconds after the fix. Each shard works out the wait for its next timer from the wall clock, then counts it down on a monotonic clock, which ignores changes to the time of day.19 The timings fit one explanation. Each shard woke 10 seconds in, for the workflow task's timeout, and found that timer not yet due by the slow clock. So it worked out a wait 2 minutes too long. Setting the clock right didn't shorten it. A clock jump can't disturb a countdown that is already running. But any wait worked out while the clock is wrong carries the error, and a restored copy wakes with its clock wrong.
With the clock set before anything reads it, a copy's age, from 2 minutes to an hour, made no difference I could repeat. On the metal host, copies 4 seconds to 30 minutes old read alike.
Name lookups have a similar trap. A lookup of a missing name took 5 seconds to fail, and the 5 seconds were not the name's: that is glibc's default wait for one try of a nameserver.20 The guest's one nameserver is the tap's address, and a lookup fails at once only when the host's refusal gets back to the guest, which reads as an ICMP reply the copy's rate limit can drop. With that limit lifted, a lookup of a missing name failed in 4 to 5 milliseconds, 3 times of 3. At the host's limit, one lookup in 3 waited out the 5 seconds.
The ideaSet a copy's clock before anything reads it. A lookup that waits out its timeout measures the timeout, not the name.
Readings and sources
- The clock was stepped back 120.9 s, 5.2 s after the timer was armed. The 60 s timer fired 121.163 s late by host time; the server recorded 60.021 s.
- The three timers were armed together, and the same step came 5.2 s later. The clock was set right at +90.5 s. The three fired 40.43 to 40.45 s after the set, within 17.8 ms of each other, at 130.9 s by the server's clock. That is the sum of 10 s, the workflow task's default timeout, and the 120.9 s step, and it fits each shard waking at that timeout.
- The failed lookup,
getent hostsin a guest, exited 2 after 5.011 s by the guest's clock. Withicmp_ratelimit0 in the copy's network namespace, three lookups of a missing name failed in 0.004 to 0.005 s; at the host's 1000, two in 0.004 s and one in 5.008 s. The guest's resolver: one nameserver, the tap's address, no search. - Three snapshots, two frozen and one not, were each leased cold at 2, 30 and 60 min of age and loaded 5 min at 20 a second after 60 s idle. The clock jumped 153.94 to 3634.83 s, the age plus 28.00 to 29.73 s; the set left it 1.7 to 4.4 ms behind, drifting 8.4 to 9.4 ppm over the next 371 to 607 s. End-to-end p95 read 79.49 to 86.00 ms, 10.82% to 15.06% of workflows over 50 ms; oldest less youngest, each less the compose load after it, -1.08 and +2.33 points frozen, -1.94 unfrozen. One, 3605.8 s old at its lease, BLOCKed at 86.00 ms against 84. The unfrozen creates took 1.43 to 1.45 s, no thaw, against 2.53 to 2.90 s frozen.
- In the same run, copies leased 5 or 6 s after their snapshot read 7.65% to 11.16%. On that share, 8 of the 9 older loads read above all 5 of them, and above all 10 of an earlier run's, every one leased 5 to 7 s after its snapshot. Computed from the VMM logs: at the resume, the guest clock read its snapshot's pause within 0.3 s (-0.295 to -0.120 s) in 21 of 24 creates, and 12.12 s past it in the 3 from a snapshot whose create took 46.06 s against 33.62 to 33.77.
- Evidence:
cells/results/2026-10-24-batchE.txt, T (the timers), with its step files' rows,docs/tables/fig-clock-step-timers.jsonl#T1.txt/and those beside it, and P5 (the lookup), on microVM cells;cells/results/2026-10-29-boot9.txt, P5 (the lookups) and P6a (the resolver); the snapshots' age,docs/tables/quotes.jsonl#cells/results/2026-10-29-boot11.txt:216, :239 and :466-467, anddocs/tables/quotes.jsonl#cells/results/2026-10-29-boot11.txt:500; on the metal host,docs/tables/quotes.jsonl#cells/results/2026-10-30-boot12.txt:440. - Try it:
bin/laug health timer 60son a leased microVM cell, with the pool set up ascells/rootfs/README.mddescribes.
Part 4 of 7
Breaking things on purpose
Stops 10 and 11
This part is Temporal's failure handling, under faults laug injects: what history concludes from a failed write, and what the layers below it hide.
Stop 10
History's three piles
However a database write fails, Temporal's history role draws one of three conclusions, and each leaves a different trace.
Temporal can fail its own database calls on purpose, per method, with one of six error types. Whatever the error, history sorts the answer into one of three piles:21
- It did not happen (ResourceExhausted, and other answers that say the write was not committed): history returns the error and does nothing more.
- Another host owns the shard (ShardOwnershipLost): history stops serving the shard until it is acquired again.
- It cannot know (timeouts, DeadlineExceeded and the rest): history renews its claim on the shard, so a late write can't land and a read after it gets a firm answer. When you can't know whether a write landed, you make sure a late one can't.
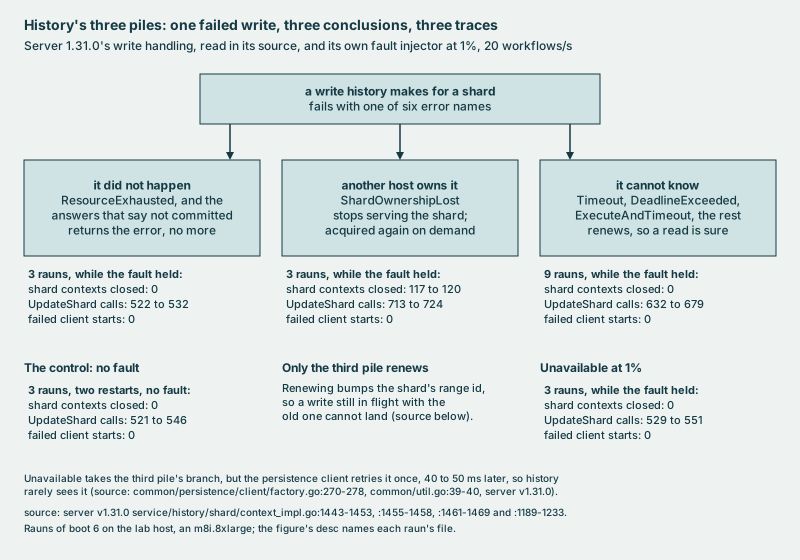
With 1% of one write method failing, clients saw no failed starts, and the piles left different traces in the shards. Under ShardOwnershipLost, history closed its hold on a shard 117 to 120 times, and under the others not once. Under the timeouts, it renewed its claim instead: 632 to 679 shard updates, against 521 to 546 with no fault. Starts failed only when taking a shard failed half the time, or when many methods failed at once.
An unknown error name makes the fault injector itself panic, as its code says it will.22 So laug refuses an unknown name in two places. A raun checks it before any load runs, and the config template laug gives history fails on it before the fault injector reads it. When I handed one to a cell directly, past the raun's check, the template refused it. History never loaded its configuration, and it restarted 10 times in 90 seconds with no panic.
The ideaAim each fault at one of history's conclusions, and count what it does to the shards, not just to latency.
Readings and sources
- 9 rows, 3 rauns each, every raun on a cold lease after a warm-up raun that isn't counted: 27 of 27 ADVANCEd.
- At 1% on UpdateWorkflowExecution: 117 to 120 shard contexts closed under ShardOwnershipLost; none under Timeout,
DeadlineExceeded or ExecuteAndTimeout, which renewed the shard instead (632 to 679 UpdateShard calls, against 521 to
546 with no fault). ResourceExhausted closed none and kept UpdateShard at the control's level, 522 to 532 calls. So
did Unavailable, at 529 to 551: the persistence client retries it before history sees it. Its 551 is 5 above the
control's top of 546, and the control's own 3 rauns span 25 calls, 521 to 546. Each count is one
increase()over the window, which extrapolates, so it isn't whole; here it is rounded. - Starts failed 343 to 367 times during the fault with shard acquisition failing half the time, and 50 to 51 times with many methods failing at once; none in the after window of any of the 27.
- The unknown name: by the 90 s cap, history had restarted 10 times, exit code 1, and no log line that says panic; its first error was laug's template refusing the name.
- Evidence:
cells/results/2026-10-27-boot6.txt, AUD, and its 27 rauns' rows indocs/tables/rauns.jsonl, raun-lab6-wf-update-* (the six wf-update rows), raun-lab6-acquire-lost-{1,2,3}, raun-lab6-persistence-chaos-{1,2,3} and raun-lab6-history-recreate-{1,2,3} (.iterations_failed,.readings.during); the readings and the extrapolation,faults/catalog.yaml:235-241 and :249-253; the refused name,cells/results/2026-10-23-boot1.txt, A8. - Try it:
bin/laug cell fi-template-check -server-tag 1.31.0checks a fault's store and method, as runbook 6 adds a fault.
Stop 11
The layer decides what you can see
Resetting database connections did nothing Temporal could see until each connection had a 50% chance of drawing the fault. The layers between the fault and Temporal hid it: they retry, reconnect and limit how fast they do it.
laug injected connection resets with Toxiproxy, a proxy between Temporal and Postgres that breaks traffic on purpose. Three layers stand in the way:23
- Toxiproxy decides once per connection whether to apply the fault. An open connection that draws it is closed at Postgres's next reply; a new one is reset in its handshake.
- Go's database/sql quietly runs a query on another connection when its own was closed, unless the query is inside a transaction. A reset in a new connection's handshake comes back to Temporal as an error.
- Temporal's SQL layer answers a lost connection by closing the role's whole connection pool. It opens a new one at most once a second.24
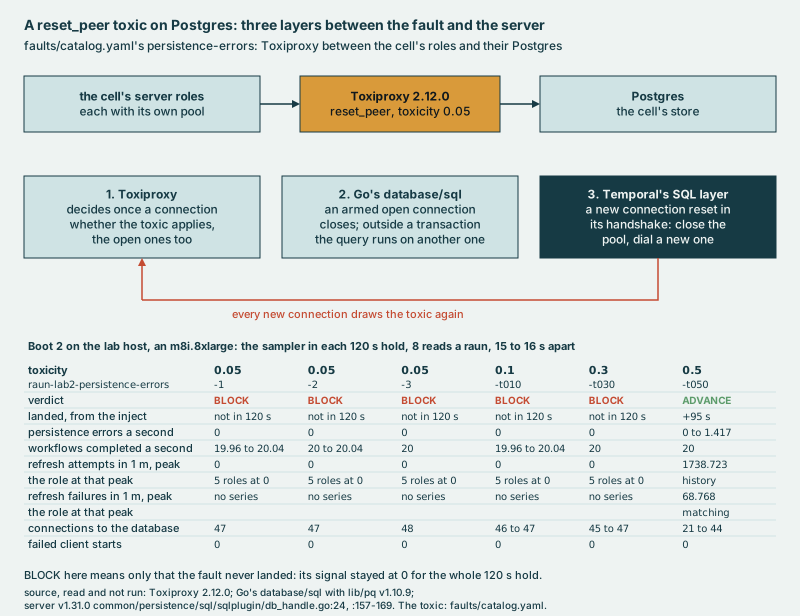
I went in expecting a fuse: one reset closes a pool, the new pool draws more resets, and the role goes dark. On the lab host, no role stopped at any rate I tried. At 30% or less, Temporal saw nothing: no error and no pool refresh. Postgres lost at most 3 of its 47 or 48 connections. At 50%, history's pool churned in the first 20 seconds and matching's at about 90 seconds. Connections fell from 44 to 21, and errors first showed between 92 and 95 seconds, but throughput held and no start failed.
The source explains the counter, not why the fuse held. The SQL layer opens a new pool at most once a second, and it counts every attempt, refused ones included.24 So history's attempts in that burst, at least 1,594 and at most 1,730, all within about 20 seconds, were at most about 20 rebuilds. The files don't say why the burst ended. One bad connection does replace every good one in its pool. That suits a failover,25 where every connection in the pool points at the same lost primary. Temporal's own fault injector (stop 10) answers this kind of question more directly.
The ideaInject a fault at the layer you want to learn about; below libraries that retry, it can show nothing.
Readings and sources
- At toxicity 0.05, 0.1 and 0.3 the rauns BLOCKed because the fault never landed: its signal, persistence errors a second, stayed at 0 over the 120 s hold, with no refresh attempt in 5 roles and 19.96 to 20.04 completions a second. At 0.5 one raun ADVANCEd, landed 95 s after the inject, with completions held at 20 a second.
- Evidence:
faults/results/raun-lab2-persistence-errors-{1,2,3}.jsonand-t{010,030,050}.json, with the sampler's readings,docs/tables/fig-toxic-fuse.jsonl#pe-persistence-errors-1.jsonl/and the fivepe-sets beside it (cells/results/2026-10-23-boot2.txt, R3 and R4). R3 and R4 call each attempt a redial of the whole pool, and R4 puts history's at about 1,730 a minute. The source allows one refresh a second, 60 a minute against those 1,730, so most were refused. - The counters: the sampler read
persistence_session_refresh_attemptsandpersistence_session_refresh_failuresasincrease()over 1 m, summed by role, and errors (persistence_error_with_type, the raun's own signal) and completions (workflow_success) asrate()over 30 s, summed with no label kept (R3). History's attempts read 1,727 to 1,739 from +16 to +61 s and 0 at +1 and +76 s: one burst, over within about 20 s of the inject, as the windows and the 5 s scrapes place it.increase()stretches a change to the window's edges, by up to 60/55 here.26 So the jump was at least 1,594, the +61 s read of 1,738.7 times 55/60. It was at most 1,730, since the +31 s read, the first whose window holds the whole burst, was 1,730.9 and a count is whole. Matching's read 0 at +92 s, 64.36 (59 times 60/55) from +107 to +137 s and 4.36 (4 times 60/55) at +152 s. So matching made 59 attempts, 55 of them at about 90 s: the 59 less the 4 that the +152 s read still held. Its failures read 68.77 at +107 s, the figure's peak, more than its 59 attempts, though each failure follows an attempt in the same call, taggedthrottlewhen refused anderrorwhen the connect fails.24 That series first read at +107 s, andincrease()stretches a young series further. The sum kept nofailuretag, so the two can't be split. - The measuring layer hides things too. History's failed refreshes never read above 0. The likely cause: that series
first appeared in the burst, and
increase()starts from a series' first sample, so what it counted before then never shows.26 The error metric also read 0 in those seconds, likely for the same cause. - Try it:
bin/laug raun persistence-errors, as runbook 3 runs a raun.
Part 5 of 7
Judging a release
Stops 12 to 14
This part is mostly laug's own: how a gate judges a release. Its Temporal lesson is that a release can change what you measure (stop 12).
Stop 12
A release can delete a reading
Since 1.32.0, Temporal runs activities eagerly by default, so on 1.32.1, the release I measured, one of laug's measurements stopped existing.
Normally a scheduled activity waits in matching until a worker picks it up, and that wait is its schedule-to-start time. Since 1.32.0, when the worker asks, the server hands an activity on the worker's own task queue straight back to that worker, and matching never sees it.27 No wait, no measurement: an alert on activity schedule-to-start, the server's or the SDK's, goes quiet for every activity a worker runs eagerly.
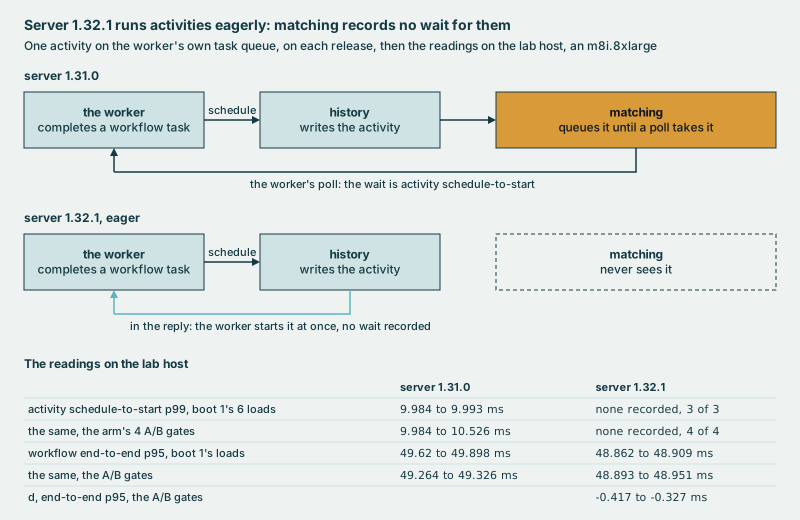
The measurement went away, and the release looked faster end to end. In three loads of each release, run one release at a time, 1.32.1 recorded no activity schedule-to-start at all, where 1.31.0's p99 read just under 10 ms; 1.32.1's end-to-end p95 was 0.7 to 1.0 ms shorter and its frontend p99 higher, 12.9 to 13.4 ms against 10.0 to 10.9, with 1.36% to 1.44% of calls past 10 ms against 0.79% to 1.09%. Loads run one at a time carry the noise of their hour (stop 14), so the gates below judge each pair in one wave, and there the gaps are small: 1.32.1's end-to-end p95 0.33 to 0.42 ms lower, and, since 1.31.0's frontend p99 sits on the 10 ms edge (stop 7), the share of calls past 10 ms compared in its place, whose gap read under 0.001 in each judged gate, inside its 0.0032 tolerance.
laug's gate treats missing data as a failure, so a vanished reading looks like breakage. A release can now have a file naming the readings it no longer produces. The one for 1.32 names activity schedule-to-start, and with it, the three loads above ADVANCEd. Missing data is still a failure for every reading no file names. I ran 1.32.1 through four gates beside a 1.31.0 incumbent, both arms under the same load. The first only recorded how the two compared; the other 3 judged them by the rule stop 14 explains. Persistence p99 sums every operation and every role, and 1.32 changed the mix, so a gap in it may be a change of mix rather than of speed; the files do not say. Of the 3 judged gates, 2 ADVANCEd and 1 BLOCKed, g20261018-092540, persistence p99 +0.401 ms against the incumbent, past the 0.35 ms tolerance. One change in the mix: history writes no activity task for an activity the worker runs eagerly. In all four gates, 1.32.1's persistence p99 read 0.14 to 0.40 ms above 1.31.0's, past the -0.181 to +0.107 ms that 30 A/A gates of 1.31.0 read with the tolerances judging. The gap is about 3% of the reading and sits at the tolerance.
The ideaA gate has to tell "no longer measured this way" from "broken".
Readings and sources
- In three 5-minute loads, 1.31.0's activity schedule-to-start p99 read 9.98 to 9.99 ms. In the 4 gates beside a 1.31.0 incumbent, 1.32.1's end-to-end p95 read 0.327 to 0.417 ms lower. The first, g20261017-222254, ran before the gate had tolerances (stop 14): it recorded the comparison but did not judge it, and ADVANCEd. The other 3, g20261018-090337, -091444 and -092540, were judged. Runbook 4 opens g20261018-092540, and CAPABILITIES' A/B row counts the 3.
- In the 3 judged gates, the frontend share's d read +0.000001 to +0.000915, under its 0.0032 tolerance.
- The reading sums every persistence operation and every role, and 1.32 changed the mix, so the gap may be a change of mix rather than of speed; the files do not say. 1.32.1's persistence p99 less 1.31.0's, computed from the 4 gates' readings: +0.140 ms to the BLOCK's +0.401 ms, mean +0.253, 1.69% to 4.98% of the incumbent's reading. The mean is 3.1% of the incumbent's mean over the 4, 8.248 ms, computed. The 0.35 ms tolerance sits inside the 4's range. All 4 sit above the -0.181 to +0.107 ms that the 30 validation gates read, A/A gates of 1.31.0 with the tolerances judging. With the 20 calibration gates, the 50 A/A gates read -0.181 to +0.163 ms, and 3 of the 4 sit above that.
- The persistence p99 is one histogram summed over every operation and every role's scrape,
load/steady-state.yaml, its persistence row's query, andcells/compose/prometheus.yml. Both arms run the same load, as the items steady and incumbent,load/README.mdandgate/plan.yaml. - The release file is
load/releases/1.32.yaml. - Evidence: the loads,
cells/results/2026-10-23-boot1.txt, D1 to D6,load/results/lab1-v1321-{1,2,3}.verdict.jsonandload/results/lab1-v13{10,21}-{1,2,3}.baseline.json(.frontend_request_p99_ms,.frontend_request_over_10ms); the first gate,docs/tables/gates.jsonl#g20261017-222254, indocs/tables/records.jsonl#cells/results/2026-10-17-lab-arm-calibration.txt, part 8; the other 3,docs/tables/gates.jsonl#g20261018-090337, -091444 and -092540, indocs/tables/records.jsonl#cells/results/2026-10-18-lab-arm-validation.txt, withdocs/tables/quotes.jsonl#cells/results/2026-10-18-lab-arm-validation.txt:293(the frontend share's d) anddocs/tables/quotes.jsonl#cells/results/2026-10-18-lab-arm-validation.txt:318and :320-330 (the persistence shift); the A/A gates,gate/sets/validation-arm-3item-m8i.8xlarge.txtandgate/sets/calibration-arm-3item-m8i.8xlarge.txt, each gate'spersistence_latency_p99_msrow indocs/tables/compare.jsonl, the 30's endsdocs/tables/compare.jsonl#g20261018-084154/persistence_latency_p99_msanddocs/tables/compare.jsonl#g20261018-064905/persistence_latency_p99_ms, the 50's topdocs/tables/compare.jsonl#g20261017-194350/persistence_latency_p99_ms; andload/steady-state.yaml, its persistence row's 0.35 ms tolerance. - Try it:
bin/laug thresholds -server-tag 1.32.1prints the limits a release is judged by, and why; runbook 1.
Stop 13
Trust a gate only once it can fail
Three rauns ADVANCEd while more than 500 workflow starts failed, under a fault expected to fail none. The server's recovery signal said nothing about the clients.
The starts failed during injected database latency, and 5 to 7 more in the 55 seconds after it. The signal watched only the server, and read it as recovered 25 seconds after the fault came off. Every raun already counted failed starts in each window, required a minimum number of completed workflows and swept for anything left running. But only the after window judges every failed start. laug records the ones that fail while a fault is held and just after it, and BLOCKs on them only when the server lost a workflow it had acknowledged. A start that fails while 200 ms is added to every database round trip is the client's to retry; a workflow the server took and then lost is the server's failure, and that is when a failed start BLOCKs. So these three would ADVANCE today. So does this fault's item in a gate: in the three gates the fold names, 546 to 551 starts failed during it, 0 after, and each ADVANCEd. What changed is the expectation: this fault's catalog row now says it stops user traffic.
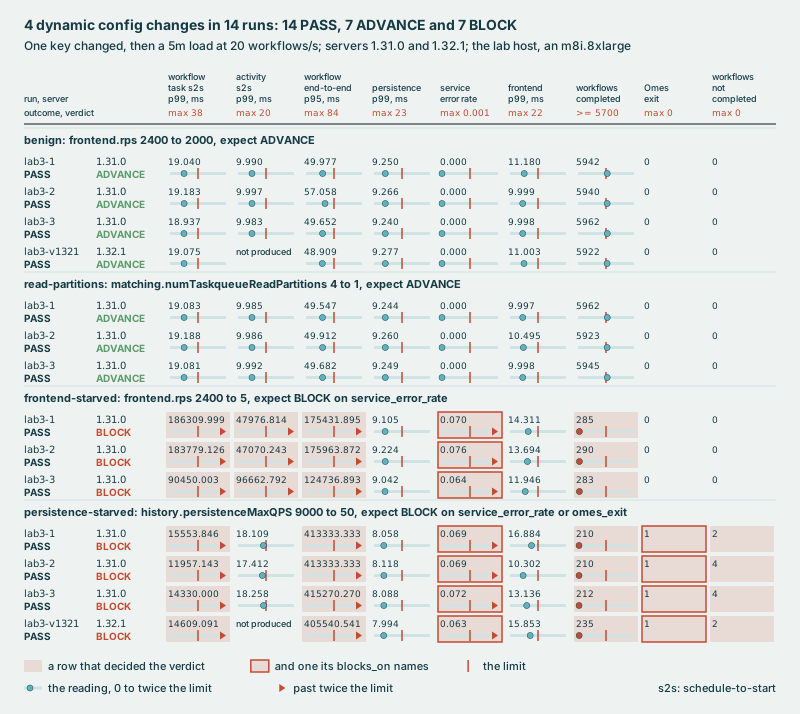
Proving it can BLOCK. A gate that has never said no hasn't told you anything yet. I fed laug four configuration changes, two harmless and two harmful, in 14 runs. Each change ran 3 times on server 1.31.0, and one harmless and one harmful change ran once more on 1.32.1. Every run got the verdict it should have: 7 ADVANCE and 7 BLOCK.
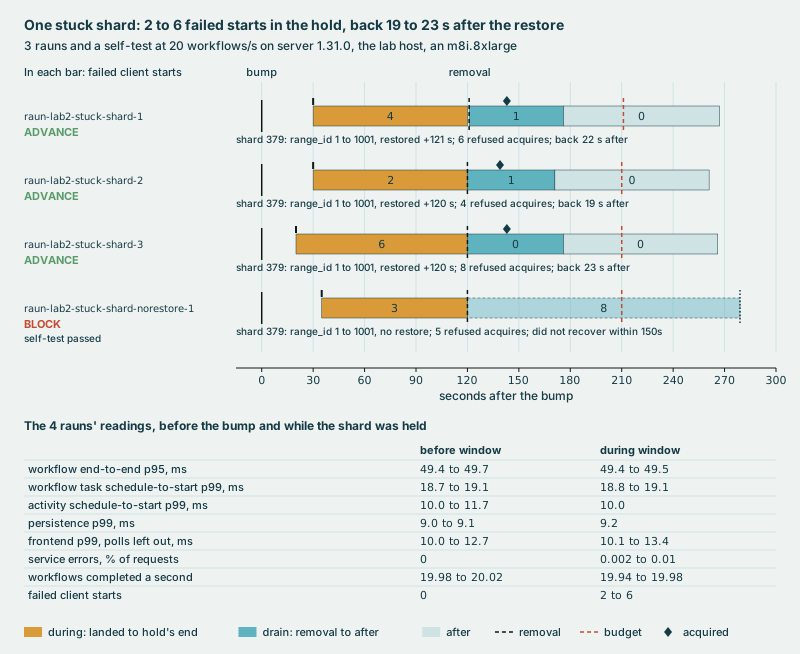
One stuck shard. An outage of one shard in 512, held for 2 minutes, got past every latency threshold. Clients saw 2 to 6 failed starts, while 1,795 to 1,995 workflows completed. The service error rate rose from 0 to as much as 0.0105% of requests, about a tenth of its limit. Only the failed-start count showed what the clients lost.
The gate's own surroundings. One harmful change, history held to 50 database calls a second, was set before a cell started. It kept that cell from becoming healthy in the 5 minutes the pool waits. The pool refused to lease it, and the gate BLOCKed without judging any reading.
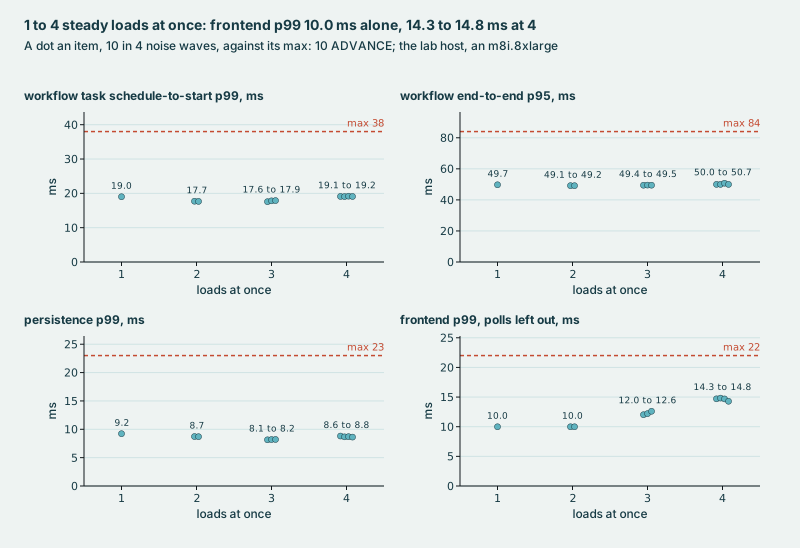
Three or four loads on the same machine raised two readings. With four at once, the frontend p99 read 14.3 to 14.8 ms, against 10.0 alone, and the activity schedule-to-start p99 11.7 to 14.2 ms, against 10.0. The other latency readings moved by less than 1.5 ms. Every reading stayed under its limit, and every item ADVANCEd.
The ideaCount what the clients saw, and make the gate catch a bad change before you trust it with a good one.
Readings and sources
- The 3 rauns this stop opens with counted failed starts by window and ADVANCEd because the after window read 0. 537 to 540 failed during the fault, and 5 to 7 in the 55 s from its removal to the after window. The signal, persistence p99 against 23 ms, was back under it 25 s after the removal.
- As a gate's item, in g20261018-091444, -092540 and -075357: 546 to 551 starts failed during the fault, 22 to 35 from
its removal to the after window, and 0 after; each item ADVANCEd. A failed start BLOCKs in the after window; before
it, only one whose error says the server lost the workflow does (
faults/run.sh:12-16,load/lost-work.sh:138-151). - The stuck shard was held 120 to 121 s; 0 or 1 starts failed from the hold's end to the after window, and the service error rate read 0 before and 0.000024 to 0.000105 during, against a limit of 0.001.
- The rate limit: with
history.persistenceMaxQPSat 50, history owned its 512 shards within 45.4 s of the gate's start, ResourceExhausted errors read 23.24 and 26.28 a second at the median, and its namespace cache failed to refresh 161 to 171 times in 288.7 s. The gate BLOCKed with the classrefused, twice. - Loads at once, one gate each, frontend p99 (limit 22 ms) and activity schedule-to-start p99 (limit 20 ms) across its items: 1, 9.99 and 9.98 ms; 2, 9.99 and 9.97 to 9.98 ms; 3, 12.03 to 12.60 and 10.13 to 10.49 ms; 4, 14.29 to 14.82 and 11.69 to 14.23 ms; every item ADVANCEd. At 5, the workflow task schedule-to-start p99 read 31.28 to 37.53 ms against its 38 ms limit; at 6, it went over the limit in 8 of 12 items; at 8, every item BLOCKed.
- A 1-minute warm-up of benign, a harmless change, BLOCKed: its window counted 1,131 workflows completed against a floor of 1,140. The warm-up is not counted in the 14.
- Evidence:
faults/results/raun-lab2-persistence-latency-{1,2,3}.json, and the gates' items,gate/results/g20261018-{091444,092540,075357}/pl/g20261018-*-pl.json(.iterations_failed,.result); the catalog row,faults/catalog.yaml:35;docs/tables/records.jsonl#cells/results/2026-10-23-boot3.txtand the rows ofcandidate-<name>-lab3-<n>; the rows of raun-lab2-stuck-shard-{1,2,3}, each indocs/tables/rauns.jsonl, anddocs/tables/fig-stuck-shard.jsonl;cells/results/2026-10-24-boot4.txt, C (g20261024-100229, -100751) and N (N1-1 to N8-2). - Try it:
bin/laug candidate benignon a leased cell;bin/laug gate control -name gate5-known-bad -fakeruns a committed control on fakes; runbook 4 runs a gate.
Stop 14
Judge against a neighbor
Fixed limits sit about twice as high as a healthy server's readings. A tighter comparison is the current release, running beside the new one at the same time.
laug's stored limits are loose: 38 ms for a reading that is normally 19, and 23 ms for one that is normally 9. So the gate also runs the incumbent, the release being replaced, on a cell of its own in the same wave. The two share the machine, the hour and the load, so what differs is mostly the release.
Fixed limits also belong to one machine. laug's limits before the lab host were set on the dev host, where a single load read end-to-end p95 at 173 to 176 ms. On the lab host a load reads about 49 ms against that set's 300 ms limit, so a release five times slower would still have ADVANCEd. The lab host's limit for that reading is 84 ms, so each of those dev-host loads would BLOCK before any fault. A gate refuses a machine its limits weren't measured on.
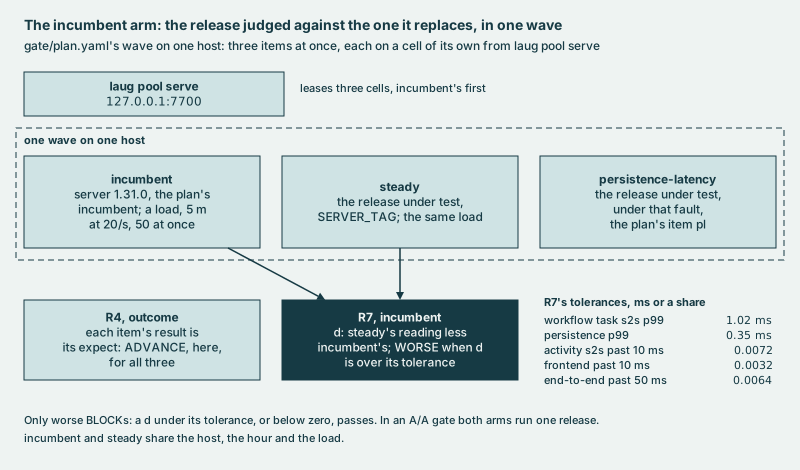
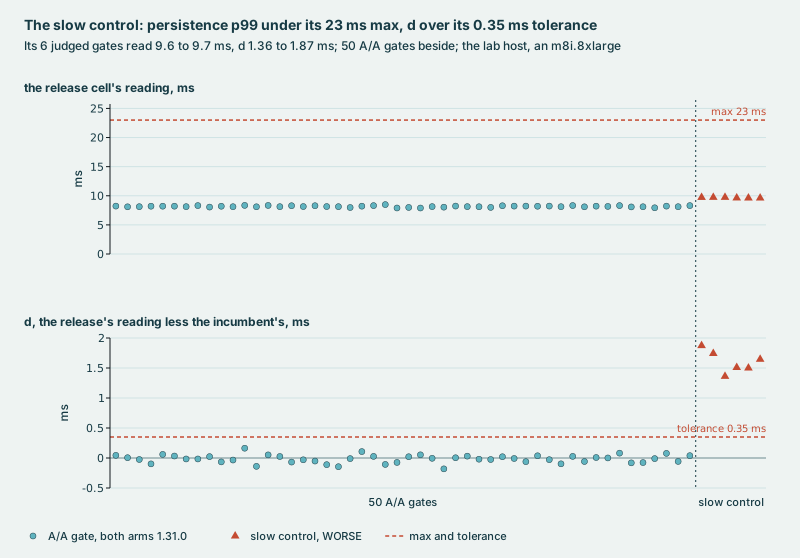
A rule called R7 compares the two. It takes d, the new release's reading minus the incumbent's, and BLOCKs when d is above its tolerance. To test it, I slowed the new release's database by 25 or 50 µs per packet, in three gates each. Its database p99 stayed at 9.6 to 9.7 ms, under the fixed limit of 23 ms, but d rose to 1.4 to 1.9 ms. A/A gates with nothing slowed read d of -0.2 to 0.2 ms. R7 flagged it in 6 gates of 6.
The comparison has its own rules:
- Near a bucket edge, compare shares, not percentiles (stop 7). In a pilot of 6 gates, the steady-load item's activity schedule-to-start p99 moved 2.33 ms from the first gate to the second. Its share past the 10 ms edge moved 0.28 points.
- Set tolerances from A/A gates. Twenty of them set the tolerances and 30 more ADVANCEd, which puts the false-BLOCK rate under 9.5% with 95% confidence.
The ideaA comparison made in the same wave cancels out the noise of the hour, so measure how far two identical neighbors drift before you trust a tolerance.
Readings and sources
- The baselines are 19.0 ms (workflow task schedule-to-start, limit 38) and 9.1 ms (persistence p99, limit 23).
- The dev host's limits were 150, 100, 300 and 50 ms for workflow task schedule-to-start, activity schedule-to-start,
end-to-end and persistence. In 6 gates under them, the lab host's steady item read 17.3 to 18.2, 10.0, 49.0 to 49.1
and 8.8 to 9.0 ms (
docs/tables/quotes.jsonl#cells/results/2026-10-15-gate6-noise.txt:27-30and :48). Five times slower is computed from the tightest, 50 ms against 9.0: 5.6 times. The dev host's single loads, under two harmless changes, read end-to-end p95 173 to 176 ms and workflow task schedule-to-start p99 48.8 to 49.1 ms (docs/tables/quotes.jsonl#cells/results/2026-10-23-boot3.txt:177-178and :222-223, which quote dev-host records kept outside the tree), each over the lab host's limit of 84 or 38 ms (load/steady-state.yaml). A gate checks the host's type against its set's (R6, DESIGN section 7);bin/laug verdictandbin/laug raunjudge byload/steady-state.yamlunless-thresholdsnames another set. - In its 6 judged gates, the slowed control's persistence p99 was 9.606 to 9.730 ms and its d 1.361 to 1.873 ms; the A/A gates read d of -0.181 to 0.163 ms. At 50 µs, 1 of the 3 gates also broke a fixed limit: its end-to-end p95 read 94.657 ms against 84. At 25 µs every fixed limit held.
- In the pilot's first two gates, the steady item's activity schedule-to-start p99 read 10.13 and 12.46 ms, and its share past 10 ms 1.01% and 1.29%; the moves, 2.33 ms and 0.28 points, are computed.
- The tolerances are 1.02 and 0.35 ms, and 0.0072, 0.0032 and 0.0064 for the shares. The false-BLOCK bound is computed: 1 - 0.05^(1/30).
- Evidence:
load/steady-state.yaml;gate/sets/calibration-arm-3item-m8i.8xlarge.txt,gate/sets/validation-arm-3item-m8i.8xlarge.txtandgate/sets/control-arm-known-slow.txt;docs/tables/quotes.jsonl#cells/results/2026-10-18-lab-arm-validation.txt:650and :652-656; the pilot's gates,docs/tables/gates.jsonl#g20261017-060633anddocs/tables/gates.jsonl#g20261017-061717, read indocs/tables/quotes.jsonl#cells/results/2026-10-17-arm-pilot.txt:302and :306. - Try it:
bin/laug gate rejudge g20261018-092540: a committed BLOCK, judged again, byte for byte; runbook 5.
Part 6 of 7
Making the judge durable
Stops 15 to 18
Stop 15 is about laug's own setup. Stops 16 to 18 show the behavior of Temporal's Go SDK, seen through the gate's own workflow. That workflow runs on the development server in the Temporal CLI 1.9.1, which runs server 1.32.0; the cells it judges run 1.31.0. On that server activities run eagerly by default (stop 12): in five of the gate's histories that laug keeps, 92 of 96 activities started within a millisecond of being scheduled.
Stop 15
A server of its own
The gate itself became a Temporal workflow, so its history has to live on a server that outlives every cell it tests.
The gate runs on a separate development server, never on a cell, and the defaults pointed the wrong way. The Temporal CLI and the Go SDK both default to port 7233,28 which during a gate is the first cell under test. So the gate's server uses ports of its own, and its worker refuses to start without an explicit address. Each code checkout uses its own task queue, and the worker's name includes its commit.
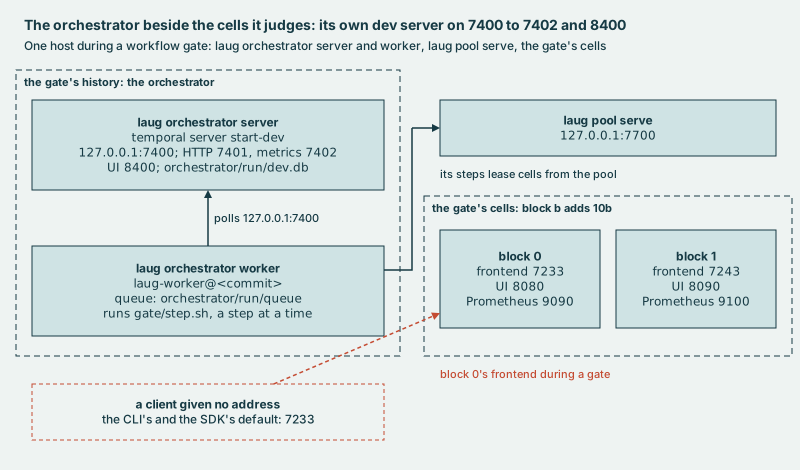
Started without explicit HTTP API and metrics ports, the development server took five random ones. And a stopped worker stays listed as polling for about 5 minutes, so laug checks whether a worker is alive with a lock file instead.
The ideaKeep a workflow's history on a server that outlives what the workflow tests, and never trust a default address on a shared machine.
Readings and sources
- The development server listens on 7400 to 7402 and 8400. Without
--http-portand--metrics-portit took its 5 extra ports from the ephemeral range, 32768 to 60999. - After an interrupt, both of the worker's pollers were still listed at 290.0 s. The workflow poller was gone at 295.1 s and the activity poller at 300.2 s.
- Evidence:
cells/results/2026-10-24-boot4.txt, F2 (the poller list) and F4 (the ports); the pinned ports incmd/laug/constants.go. - Try it:
bin/laug orchestrator server, thenbin/laug orchestrator workerandbin/laug orchestrator probe. Runbook 4 runs a workflow gate on the server and worker.
Stop 16
A cancel is a request
Canceling an activity only asks it to stop. The activity hears the request at its next heartbeat, and only a real cancel carries a CanceledError.29
An activity's context can end for many reasons: a deadline, the worker shutting down, a pause or a reset. laug's steps stop nothing when their context ends; only the gate's stop path stops a step, with an activity of its own. An activity that cleans up has to keep heartbeating, on a context the cancel doesn't close.
On the lab host I made a step keep waiting for its processes through a cancel. When it sent its heartbeats on the canceled context, each beat after the first failed on the worker.30 The server timed the step out 10 seconds after the cancel, while those processes still ran. On a context the cancel doesn't close, the same step beat for 90 seconds, until they ended, and never timed out. Both gates still gave their verdict.
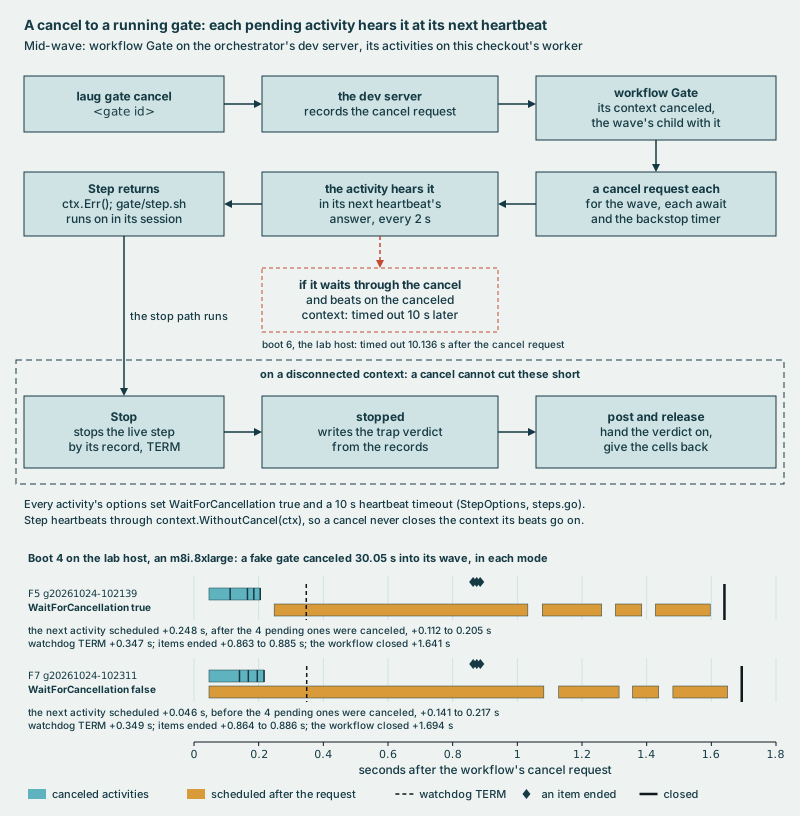
A setting called WaitForCancellation decides when the workflow hears that an activity has stopped. Set to true, the workflow waited about a quarter of a second for all four activities to confirm. Set to false, it moved on at once. Both ended with the same verdict. The Go SDK's test environment resolves a cancel instantly.31
The ideaHeartbeat, keep heartbeating through the cleanup, and tell a cancel from every other cause before you stop anything.
Readings and sources
- The gate was canceled 30 s into a fake wave. The four activity cancels went out 0.046 s after the request either way. The stop path was scheduled at 0.248 s with true and at 0.046 s, in the same workflow task, with false. Both sent the items their stop at 0.35 s; the items ended at 0.86 to 0.89 s, and the workflows completed at 1.64 and 1.69 s, with the same BLOCK.
- Four more fake gates were canceled 30 s into the wave, each on a build of its own: the tree's; one whose step beats on the canceled context; one whose step waits for its processes through the cancel; and one with both. Only the last timed out: ACTIVITY_TASK_TIMED_OUT, of type heartbeat, 10.136 s after the cancel request. Its first beat after the request was answered canceled and the next five failed on the worker; the stop path then stopped the items, and the workflow completed at 11.883 s.
- Heartbeating on a context the cancel doesn't close, the waiting step beat every 2 s and completed at 90.220 s, when its items ended, and the workflow, which with WaitForCancellation true waited for it, at 90.825 s. The other two returned at their first beat after the request, at 0.180 and 0.122 s, so neither beat on a canceled context. In each, computed from the events, the Stop activity ran 31.0 s, since a stuck item ignored TERM and was killed after its 30 s of kill grace. The whole stop path, Stop through the release, ran 31.6 s: three times the 10 s heartbeat timeout, and nothing timed out. All four gave the trap verdict, BLOCK.
- Evidence:
cells/results/2026-10-24-boot4.txt, F5 and F7, with their events,docs/tables/fig-cancel-path.jsonl#f5-events.json/anddocs/tables/fig-cancel-path.jsonl#f7-events.json/;cells/results/2026-10-27-boot6.txt, SAN10, withextra/san10-{control,hctx,wait,waitctx}-events.jsonindocs/tables/records.jsonl#cells/results/2026-10-27-boot6/. - Try it: with stop 15's server and worker running, start a fake workflow gate whose items last 120 s with
FAKE_GATE_ITEM_S=120 bin/laug gate run 1.31.0 -fake -workflow, then cancel it withbin/laug gate cancel <gate id>.
Stop 17
A retry is not a new event
If a worker is lost while an activity runs, the next worker takes over the same activity, and the history records only the attempt that finished.
When I killed a worker with SIGKILL to its process group, the server noticed after the 10-second heartbeat timeout. It offered the step to the next worker, which adopted it instead of starting it again. Every attempt before the last happens off the record: the history learns about the lost worker only as the last failure of the attempt that finished.32
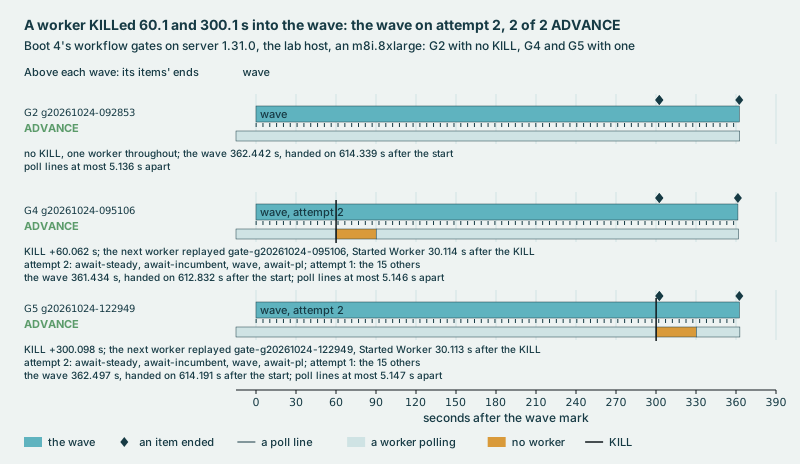
They gave the same verdict as gates with no kill, in the same time: 612.5 to 614.3 seconds after the start.
Unlimited retries are safe only because a step can never run twice. It writes a pid file first, a second copy refuses to start, and the error that means "the guard failed" is never retried. Heartbeats need margin too. The Go SDK throttles them to 80% of the heartbeat timeout, by design,33 which leaves 2 seconds on a 10-second timeout; laug caps the throttle at 2 seconds to leave more.
The ideaThe history shows only the attempt that finished, so work that must not run twice needs its own guard.
Readings and sources
- The kills came 60.1 and 300.1 s into the wave. The wave and its three awaits ran on attempt 2, and the other 15 activities on attempt 1. The 2 killed gates and 2 with no kill, G2, the same gate run as a workflow, and G1, run without one, gave their verdicts 612.5 to 614.3 s after the start. All 4 had the same verdict signature: the 16 fields laug's same-verdict check compares, including the verdict, its class and the failed rules.
- Evidence:
cells/results/2026-10-24-boot4.txt, G1, G2, G4 and G5, withdocs/tables/fig-adopted.jsonl#g20261024-095106/g4-attempts.json/anddocs/tables/fig-adopted.jsonl#g20261024-122949/g5-attempts.json/; the timeout and the guard ininternal/orchestrator/steps.go, the cap ininternal/orchestrator/worker.go. - Try it:
go test ./internal/orchestrator -run TestReplayGateHistoriesreplays the adopted gate with no server; runbook 4 runs a workflow gate.
Stop 18
Every wait is an event
In a workflow, every wait ends on an event the history records, and every one has to replay the same way on the next build.
In laug's gate workflow, a sleep is a timer. Waiting for the wave means waiting on several things at once: the wave's step, each item and a backstop timer. A cancel becomes one cancel command for each pending activity and timer. A two-item gate records 17 activities from start to finish, and a three-item gate 19. Each count holds two checks that the host is quiet, an activity each; a busy host takes more checks.
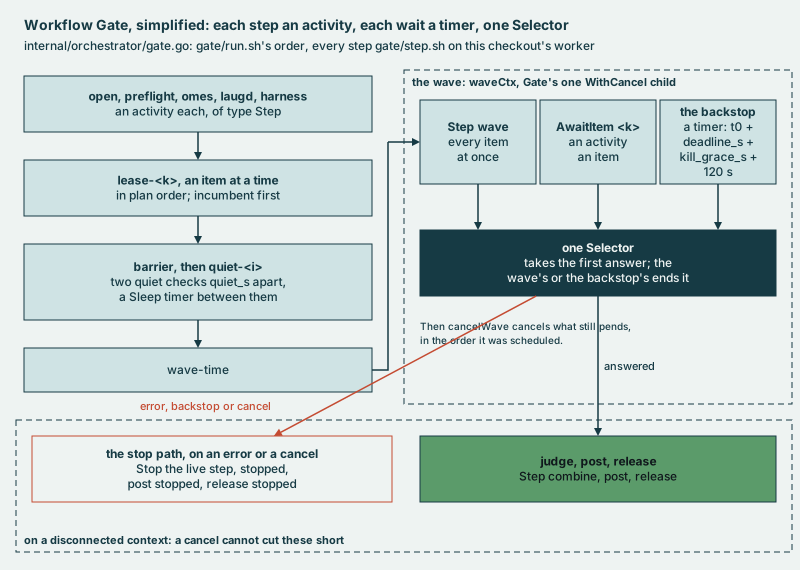
The gate's code keeps three rules:
- One cancelable child context. The order of cancel commands is recorded. In Go SDK 1.49.0, with two child contexts, the SDK cancels them in Go's map order, which can differ from run to run,34 so the gate keeps a single one. Go SDK 1.50.0 cancels in creation order by default.35
- Named activities. Replay matches activities by ID, and checks their type once the history has replayed (stop 2).36 So each one is named for its step.
- Replay before work. Before a new worker takes any work, it replays every open gate on its own code, and refuses to start if one would fail.
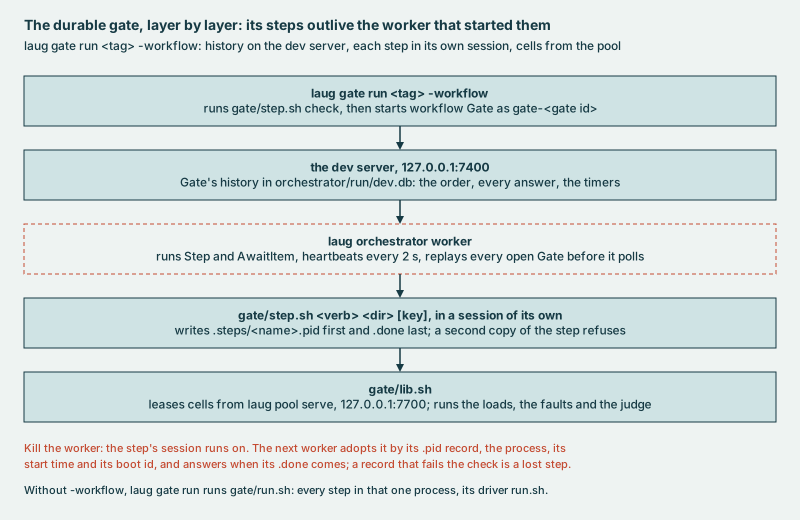
A killed script would have left its processes, the pool and its lock behind. A killed worker leaves nothing to clean up: the gate never lived in the worker's process, and the next worker adopts the steps still running.
The ideaThe workflow adds durability, not judgment.
Readings and sources
- Evidence: jq
[.events[].activityTaskScheduledEventAttributes.activityId // empty] | lengthoverinternal/orchestrator/testdata/histories/real.json(17) and the rows ofdocs/tables/fig-adopted.jsonl#g20261024-095106/g4-attempts.json/(19), each with two checks, quiet-0 and quiet-1; the checks' loop ininternal/orchestrator/gate.go. Eager starts, Part 6's opening, computed as each ActivityTaskStarted's time less its ActivityTaskScheduled's, overreal.json(17 of 17 within 1 ms, 0.014 to 0.206 ms) andextra/san10-{control,hctx,wait,waitctx}-events.jsonindocs/tables/records.jsonl#cells/results/2026-10-27-boot6/(75 of 79; each history's one slower start, await-pl, 21.9 to 22.7 ms); the server's version,cells/results/2026-10-24-boot4.txt:127. - Try it:
go test ./internal/orchestrator -run TestReplayCancelledFiftyTimes, with no server; runbook 4 runs a workflow gate.
Part 7 of 7
Seeing it
Stop 19
This part is mostly laug's monitoring. Its Temporal lesson is what a trace span means.
Stop 19
Metrics outside the cell, and what a trace shows
A metrics store that collects from other servers needs staleness tracking, or a stopped service still shows its last values for almost 5 minutes.
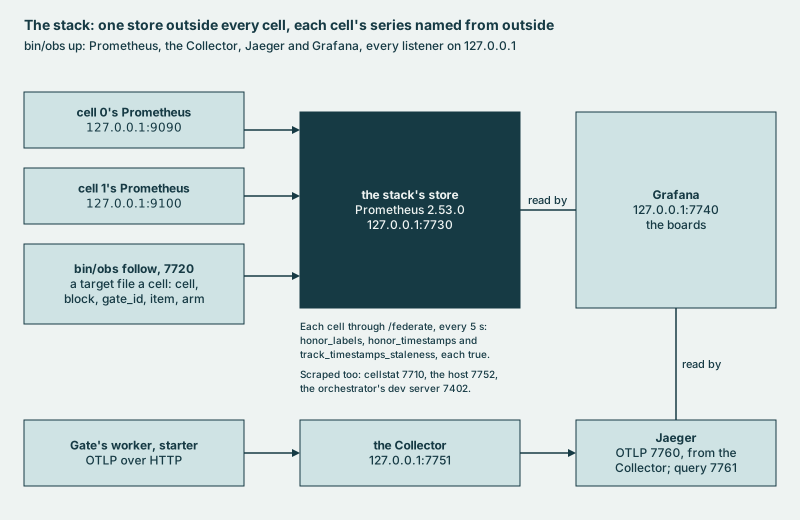
Each cell has its own Prometheus, which goes away with the cell, so one store outside the cells collects their metrics. It needs three things the cells never did: a label naming each cell, because every cell's metrics look identical; the cells' own timestamps; and staleness tracking.
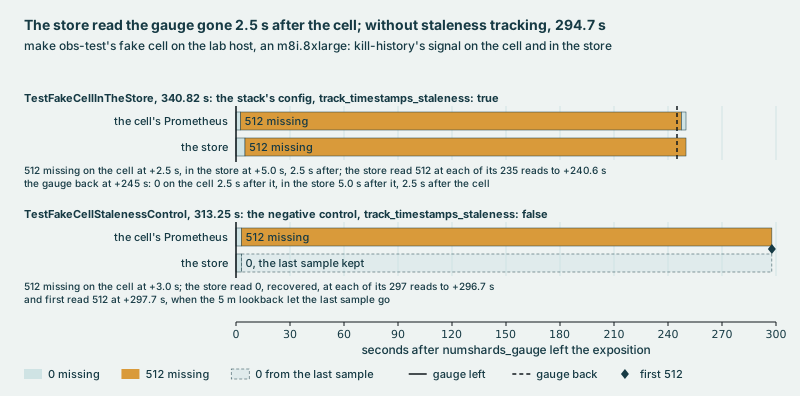
With all three, the store matched the gate's own files to within 2 × 10-14. Without staleness tracking, a gauge that vanished kept its last value for almost 5 minutes, against 2.5 seconds with it. Collected samples keep their source's timestamps, so Prometheus never marks them stale on its own,37 and the last good value lingers until its lookback window runs out.
Traces need care too. A RunWorkflow span is one replay of the workflow, not one run of it.38 I traced a gate and killed its worker mid-wave. The gate ran once, and the next worker recorded 34 RunWorkflow spans of it, 2 seconds apart at the median. That is the pace of the starter's progress queries, so each query most likely made the worker replay the gate. Only 1 of the 34 started anything. And the killed worker exported no RunWorkflow span at all. Its 16 StartActivity spans point at a parent the store never got, while the history still held every step's result.
The ideaTrust the history for what a workflow did. A trace shows what the workers did, replays included.
Readings and sources
- The 2 × 10-14 agreement is relative. 294.7 s is computed: the store at +297.7 s, less the cell's +3.0 s.
- The trace: a fake workflow gate, its worker killed 30.03 s into the wave and a new one started 30 s later. Jaeger
answered with 73 spans: 28 of the killed worker, 44 of the new one and 1 of the starter. The killed worker's were 13
StartActivity:Step, 3 StartActivity:AwaitItem and 12 RunActivity:Step, none RunWorkflow; all 16 StartActivity spans
name one parent, which no span holds. The new worker's 34 RunWorkflow spans ended 2.000 s apart at the median,
computed from their end times, and the starter queries progress every 2 s (
internal/orchestrator/starter.go); 33 have no child, and 1 is the parent of the StartActivity spans of judge, post and release. In the history, the wave and its three awaits ran on attempt 2 and the other 15 activities on attempt 1; the gate ADVANCEd. - Evidence:
docs/tables/quotes.jsonl#cells/results/2026-10-18-lab-obs.txt:453and :509;cells/results/2026-10-24-boot4.txt, F12 (TestFakeCellInTheStore and TestFakeCellStalenessControl), withdocs/tables/quotes.jsonl#cells/results/2026-10-24-boot4/steps/F12.txt:94;_obs/prometheus.yml; the trace,cells/results/2026-10-27-boot6.txt, SAN2, withextra/san2-g20261027-042644-trace.jsonandsan2-attempts.jsonindocs/tables/records.jsonl#cells/results/2026-10-27-boot6/. - Try it:
make obs-testruns both fake-cell tests;bin/obs upstarts the stack, as_obs/README.mdsays.
What I assumed
These are conclusions I drew from the readings or the source, not ones a run has shown. Each names what it rests on and the run that would settle it.
- Stop 3. The first start's "Namespace default is not found" was a frontend's namespace cache lagging the database. Rests on the namespace answering a describe just before it; a run that polls each frontend for the namespace before the first start would settle it.
- Stop 4. The starts that failed just after the restart were sent during the outage. Rests on their timing, 49 every 10 seconds with 50 in flight; a run that logs each start's send time would settle it.
- Stop 6. History came back when Docker's restart backoff allowed it. Rests on the backoff's source and the timing; a run that logs Docker's restarts beside history's shards would settle it.
- Stop 8. A snapshot loads in a hundredth of a second because its memory file is mapped, not read. Rests on 0.01 s for about 4 GiB; a restore that counts the guest's page faults would settle it.
- Stop 8. Nearly all of the gap seen nested was the cost of nesting itself. Rests on one metal host with C6 and C6P off; the same loads on a second metal type, and nested on it, would settle it.
- Stop 8, the fold. The host's extra busy CPUs at 8 vCPU are partly KVM halt polling. Rests on its documentation; several 8 vCPU cells loaded at once would settle it.
- Stop 8, the fold. One run's check for a running package upgrade matched an idle helper, not an upgrade. Rests on a process of that name found at the next start; the check run beside that helper alone would settle it.
- Stop 9. After the clock step, each shard woke at the workflow task's 10-second timeout. Rests on the sum, 10 s plus the 120.9 s step; the same step with another workflow task timeout would settle it.
- Stop 9. A lookup's fast failure is the host's ICMP refusal, which the copy's rate limit can drop. Rests on the limit moving one lookup in 3 from 5 s to 5 ms; a packet capture on the tap during a lookup would settle it.
- Stop 11. One bad connection closes the whole pool because, in a failover, every connection points at the same lost primary. Rests on the source and its commit; a failover of a cell's Postgres would settle it.
- Stop 11, the fold. The error metric and history's failed refreshes read 0 in the burst because their series first
appeared then. Rests on
increase()'s source; a sampler that reads the raw counters would settle it. - Stop 11, the fold. Matching's failures read more than its attempts because
increase()stretches a young series further. Rests on the same source; the same sampler would settle it. - Stop 12. The 1.32.1 persistence shift is not noise, and may be a change of mix rather than of speed. Rests on 4 of 4 A/B gates above 1.31.0, all 4 past every one of the 30 validation gates, A/A gates of 1.31.0 with the tolerances judging; more A/B gates of the two would settle the first, persistence latency read by operation the second.
- Stop 19. Each progress query made the worker replay the gate. Rests on 34 RunWorkflow spans, 2 seconds apart, the starter's query pace; a trace at another pace would settle it.
What's next
Three Temporal ideas aren't in laug yet: child workflows, continue-as-new, and a durable "wait for capacity" built from a retry policy with a time budget. A child workflow keeps its own history, and a workflow has to drain its waiting signals before it continues as new, or it loses them.39 A parked per-cell workflow that no worker registered, deleted since, showed what is missing: it continued as new without draining its signals, and its activities retried a pool refusal forever, with no time budget.
What I would build next is reach: an upgrade in place as a gate item; several history processes in a cell, so a shard can move and membership can change; the incumbent under the same fault as a fourth item, so a release that degrades worse under it cannot ADVANCE on clean recovery alone; and a load above 20 workflows a second.
The stops also leave ten questions open:
- What an upgrade in place would show that a cell of its own for each release does not. The item: a cell on the incumbent, upgraded to the new release under load, its schema updated first (stop 14).40
- Whether stop 12's persistence shift is a change of speed or of mix. The reading sums every operation and role, so the same A/B gates, with persistence latency read by operation, would tell the two apart. Until they run, I say no more about the 0.401 ms than stop 12 does.
- Why 1.32.1's frontend p99 read 12.9 to 13.4 ms against 10.0 to 10.9 in loads run one release at a time, when its share past 10 ms barely moved in the same-wave gates; a server that does more work before it answers a workflow task completion, now that the reply carries the activity, is one candidate (stop 12).
- What a gate should do when one pair's d straddles the tolerance across gates, as 1.32.1's persistence p99 did at 0.14 to 0.40 ms against 0.35: more gates of the pair, and one verdict on the set (stop 12).
- Whether persistence p99, which sits under the 10 ms edge, should be judged by its share past the edge as well (stops 7 and 14).
- Why, in 3 of 10 cells, a frontend logged the mismatch and stayed up, when its one retry should fail too (stop 5).
- Whether finer bucket edges near the thresholds, set in
perUnitHistogramBoundaries, are worth what they cost. Every committed run read the default edges, and a run on new edges compares with none of them (stop 7). - Whether a nested copy's frontend runs slow in its first minutes awake: the runs support it and do not prove it (stop 8).
- Whether a nested copy leased 5 or 6 seconds after its snapshot reads lower because it is young, not because it ran later. On the lab host that step is not tested. On the metal host, copies 4 seconds to 30 minutes old read alike (stop 9's fold).
- Why history's burst of pool refresh attempts ended: the files don't say (stop 11).
If I started again, I'd make every check prove it can fail before I trusted it (stops 2 and 13). I would change a stop for a run that contradicts it on the same release and the same kind of machine, or for one of the runs that What I assumed names. A new release can force a change too: 1.32 deleted a reading, and that became stop 12.
Read in source
Claims marked with a number were read in source code or documentation, not measured. Each points at the version, file and line, or the page.
-
docs.temporal.io, the Temporal Cloud page Overview, its section Cell-based infrastructure: "Each cell is a self-contained deployment unit", with its own primary database. back
-
go.temporal.io/sdk v1.49.0, internal/workflow.go:753-763 and internal/internal_flags.go:58; the flag is still off by default at v1.50.0, internal/internal_flags.go:58. back
-
docs.temporal.io, the page Worker Versioning, its section Versioning behaviors: "A Pinned Workflow is guaranteed to complete on a single Worker Deployment Version"; an Auto-Upgrade workflow moves to the new current version. go.temporal.io/api v1.63.5, enums/v1/workflow.pb.go:774-791. back
-
go.temporal.io/sdk v1.49.0, internal/internal_task_handlers.go:1286-1290 and 1642-1690, and internal/internal_command_state_machine.go:1147-1152. back
-
go.temporal.io/server v1.31.0, common/persistence/sql/shard.go:124-175 and common/persistence/sql/execution.go:39-58. back
-
go.temporal.io/server v1.31.0, service/history/service.go:79-90. back
-
go.temporal.io/server v1.31.0, common/persistence/sql/cluster_metadata.go:95 and temporal/fx.go:600, 683-718 and 776-825; the one retry, with the same version, 40 to 50 ms later, worked out from a 50 ms first interval less up to 20% jitter: common/util.go:39-40, common/persistence/client/factory.go:192, common/persistence/persistence_retryable_clients.go:1015-1028 and common/backoff/retrypolicy.go:178-185. back
-
go.temporal.io/server v1.31.0, common/config/config_template_embedded.yaml:272 and :320, the address each role writes, 7233 unless set; temporal/fx.go:788-807, what a role compares before it rewrites the record, and :728-774, the record's first write. back
-
go.temporal.io/server v1.31.0, common/config/config_template_embedded.yaml:360-362 (
pollInterval: "60s"), the template the image renders when given no config file; common/dynamicconfig/file_based_client.go:133-141, the ticker, and temporal/fx.go:220, where each process builds the client as it starts. back -
go.temporal.io/server v1.31.0, common/quotas/dynamic_rate_limiter_impl.go:126-139, a new rate taken up on the first call after a one-minute timer; service/frontend/configs/quotas.go:346 and :348, the frontend's limiters, fed frontend.rps through service/frontend/fx.go:446. back
-
moby docker-v29.1.3, daemon/internal/restartmanager/restartmanager.go:12-14 and :67-77 (read in source): the delay starts at 100 ms, doubles after each restart up to 1 minute, and resets once a container has run 10 seconds. back
-
go.temporal.io/server v1.31.0, common/metrics/config.go:239-258. back
-
go.temporal.io/server v1.31.0, common/metrics/config.go:52, the config key
perUnitHistogramBoundaries, and :373-394, where a unit's list in the config replaces that unit's defaults, applied as the metrics handler is built at :464; common/config/config_template_embedded.yaml:251-256, the template the image renders, sets only the Prometheus timer type and address. back -
Prometheus v2.53.0, the cells' image (cells/compose/cell.yml:268), docs/querying/functions.md:318-319: histogram_quantile() "interpolates quantile values by assuming a linear distribution within a bucket". back
-
go.temporal.io/server v1.31.0, common/dynamicconfig/constants.go:1158-1162, matching.longPollExpirationInterval, one minute by default. back
-
go.temporal.io/server v1.31.0, service/matching/task_queue_partition_manager.go:461-464: the root partition answers a forwarded task no worker took with errRemoteSyncMatchFailed, which physical_task_queue_manager.go:114 makes a Canceled; the child that forwarded it then stores it (:458 and :472). back
-
Firecracker v1.17.0, src/vmm/src/device_manager/persist.rs:201-210, a new ID and a notification on each restore, and docs/snapshotting/snapshot-support.md:611-621; Linux v6.18.51, drivers/virt/vmgenid.c:26-36 and :161-163, with CONFIG_VMGENID=y in Firecracker's guest config for 6.18, resources/guest_configs/microvm-kernel-ci-x86_64-6.18.config:2512. One run counted one "crng reseeded" line in each of two copies, whose /dev/urandom bytes differed (
cells/results/2026-10-29-boot9.txt, P6a). back -
The Linux kernel's KVM halt-polling documentation, Documentation/virt/kvm/halt-polling.rst: a halted vCPU's thread polls for a while before it sleeps, and yields when another task wants the CPU. back
-
go.temporal.io/server v1.31.0, common/timer/local_gate.go:80 and :90-91; the workflow task's default timeout, 10 s, at common/primitives/constants.go:16. back
-
resolv.conf(5), the
timeoutoption. back -
go.temporal.io/server v1.31.0, service/history/shard/context_impl.go:1443-1469; an Unavailable answer is retried before it reaches history, common/persistence/client/factory.go:217 and :270-278. back
-
go.temporal.io/server v1.31.0, common/persistence/faultinjection/fault.go:34-55, the six error names, :56-57, the panic, and :29-30, the comment that says an unknown name panics. back
-
Toxiproxy 2.12.0, toxics/toxic.go:84-85 (one draw a connection), toxics/reset_peer.go:21-33, and link.go:95-107 and :171-192 (SetLinger(0), so a reset, only on a connection opened after the toxic); Go 1.26.2, the go line of server v1.31.0's go.mod, database/sql/sql.go:1572-1584 (a retry only on driver.ErrBadConn) and :2511-2536 (none inside a transaction); github.com/lib/pq v1.10.9, error.go:506-508 (a plain close, io.EOF, becomes driver.ErrBadConn) and conn.go:343-348 (an error while opening a connection never does); go.temporal.io/server v1.31.0, common/persistence/sql/sqlplugin/db_handle.go:157-169, and postgresql/db.go:66-71 and :132-135 (a transaction's errors reach it too); the cells' postgres12 (cells/compose/cell.yml:37) runs on lib/pq (common/persistence/sql/sqlplugin/postgresql/plugin.go:38-42). back
-
go.temporal.io/server v1.31.0, common/persistence/sql/sqlplugin/db_handle.go:24 (one refresh a second), :88-91 (the old pool dropped and closed), :94 (every attempt counted, before the limit at :98-103), :101-102 and :110-111 (after its attempt, a failure tagged
throttlewhen refused orerrorwhen the connect fails) and :135-155 (a call that finds no pool makes an attempt); unchanged at v1.32.1 and on main at 6621127. The two counters are named at common/metrics/metric_defs.go:1470-1471, and the tagfailureat :8, both at v1.31.0. backbackback -
go.temporal.io/server v1.31.0, common/persistence/sql/sqlplugin/db_handle.go:157-169 and postgresql/driver/interface.go:30-38, reached through postgresql/plugin.go:67 and postgresql/driver/pq.go:46-52: besides the six connection errors at db_handle.go:159-164, an error closes the pool only if it carries Postgres code 25006 (read-only transaction), 57P03 (cannot connect now) or 0A000 with "cannot set transaction read-write mode during recovery"; the same at v1.32.1 and on main at 6621127, at interface.go:32-40 and pq.go:51-57. The commit that added the close, 797bbdf, says every error on its list was seen in tests of an Aurora failover. back
-
Prometheus 2.53.0, the cells' image (cells/compose/cell.yml:268), promql/functions.go:107 (from the first sample in the window to the last) and :124-161 (the stretch to the window's edges); cells/compose/prometheus.yml:4 (5 s scrapes). backback
-
go.temporal.io/server v1.32.1, common/dynamicconfig/constants.go:204-205: system.enableActivityEagerExecution defaults to true, as at v1.32.0, :204-205; at v1.31.0, :194-195, to false. At v1.32.1, when the worker asks for it and the setting is on, history schedules the activity without the task matching would queue: service/history/api/respondworkflowtaskcompleted/workflow_task_completed_handler.go:542-556 and service/history/workflow/mutable_state_impl.go:4216-4222. go.temporal.io/sdk v1.49.0, internal/internal_eager_activity.go:50-67: the worker asks only on its own task queue, with a free slot; the SDK records its own schedule-to-start only for a polled activity, internal/internal_task_pollers.go:1700-1701. back
-
The Temporal CLI's
--addressflag reference; go.temporal.io/sdk v1.49.0, client.DefaultHostPort. back -
go.temporal.io/sdk v1.49.0, internal/internal_task_handlers.go:51-59, :2278-2281 and :2646-2647, a cancel in a heartbeat's answer, and :2480-2482. A cancel pushed to the worker, :2149, needs two server settings that are off by default at go.temporal.io/server v1.32.0, common/dynamicconfig/constants.go:208-212 and :3622-3626. back
-
go.temporal.io/sdk v1.49.0, internal/internal_activity.go:413, a heartbeat is sent with the context it is given, and internal/internal_task_handlers.go:2205-2232, a batch of heartbeats with the context of the call that opened it. back
-
go.temporal.io/sdk v1.49.0, internal/internal_workflow_testsuite.go:1107-1123. back
-
go.temporal.io/server v1.31.0, service/history/workflow/mutable_state_impl.go:4140-4144, a started activity kept out of the history while it may be retried, and :4065-4074, its started event written when the task closes, with the attempt and the last failure. back
-
go.temporal.io/sdk v1.49.0, internal/internal_task_handlers.go:2597-2620; the same 80% rule at v1.50.0, internal/internal_task_handlers.go:2607-2630. back
-
go.temporal.io/sdk v1.49.0, internal/context.go:370-377, with SDKFlagOrderedChildCancel off by default at internal/internal_flags.go:61. back
-
go.temporal.io/sdk v1.50.0, internal/internal_flags.go:61, SDKFlagOrderedChildCancel on by default, and internal/context.go:280-287. back
-
go.temporal.io/sdk v1.49.0, internal/internal_task_handlers.go:1653-1665. back
-
Prometheus v2.53.0, docs/querying/basics.md:355-357, the section Staleness, and docs/configuration/configuration.md:225-241, honor_timestamps and track_timestamps_staleness. back
-
go.temporal.io/sdk v1.49.0, interceptor/tracing_interceptor.go:494-519, a RunWorkflow span each time ExecuteWorkflow runs, its start set to the workflow's start at :507 (the field's comment, :117-118), and :806-808, no child span while replaying. back
-
docs.temporal.io, the pages Child Workflows and Continue-As-New, and the Go SDK's page Workflow message passing, on draining the Signal channel. back
-
docs.temporal.io, the page Upgrade the Temporal Server: one minor version at a time (Key considerations), and the database schema updated before the server, with temporal-sql-tool for PostgreSQL (Step-by-step upgrade procedure). back